
Airbnb (ABNB) - Fundamental Analysis Report 2026 (Updated)

Dear Readers, Welcome to Deep Research Global.
Let’s analyze the topic in detail.
Executive TL;DR
Airbnb (ABNB) closed FY2025 with $12.2 billion in revenue, $2.5 billion in net income, $4.6 billion in free cash flow, and a 35% Adjusted EBITDA margin, then accelerated into Q1 2026 with 18% revenue growth to $2.68 billion.
The company is moving from a single-product platform (homes) to a multi-product travel ecosystem after the 2025 Summer Release added Services, refreshed Experiences, launched boutique hotel pilots, and rebuilt the consumer app.
Capital return is aggressive but disciplined: Airbnb repurchased $3.79 billion of stock in 2025 and another $1.1 billion in Q1 2026, with $4.5 billion remaining on the authorization at quarter-end.
Management raised full-year 2026 guidance to low-to-mid-teens revenue growth with an Adjusted EBITDA margin of at least 35%, driven by international expansion, AI-led cost leverage, and new product flywheels.
Table of Contents
Executive TL;DR
Introduction
Airbnb Company Profile: Key Facts
Airbnb Investment Thesis
The Platform Premise
Why 2026 Matters
Compounding Cash Returns
Airbnb Business Model Overview
The Two-Sided Marketplace
Service Fee Structure
Geographic and Product Mix
How Money Moves Through the Platform
Airbnb Revenue Analysis
Long-Term Revenue Trajectory
Q1 2026 Revenue Deep-Dive
Quarterly Trends
Regional Mix
Take Rate Dynamics
Q1 2026 Quarterly Earnings & Guidance
The Headline Print
Q2 2026 and Full-Year Guidance
Guidance Risks Flagged by Management
Margins, Earnings Quality, and EPS Trajectory
Gross and Operating Margin Architecture
Earnings Quality
EPS Trajectory
Cash Flow Mechanics
Free Cash Flow Algorithm
Seasonality
Capital Expenditure Profile
Balance Sheet Health
Liquidity Position
Capital Allocation Framework
Share Count Compression
Segment-by-Segment Teardown
Homes (The Core Business)
Experiences (Relaunched in 2025)
Services (New in 2025)
Hotels (Pilot)
Strategic & Competitive Context
The Online Travel Landscape
Booking Holdings as Primary Competitor
Vrbo and the Expedia Stack
Adjacent Threats
Brand and Direct Traffic Moat
Geographic Expansion Strategy
The Five-Country Reality
The Localization Playbook
Major-Event Strategy
Leveraging AI: Operating Leverage and Product Innovation
AI in Customer Support
AI in Engineering Productivity
AI in Search and Discovery
Valuation Framework
Multiples Snapshot
What the Market Is Pricing In
Discounted Cash Flow Framing
Sum-of-the-Parts Considerations
Bull, Base, and Bear Case Scenario Analysis
Bull Case
Base Case
Bear Case
Key Risks
Risk 1
Risk 2
Risk 3
Risk 4
Risk 5
Catalysts to Watch in 2026
Near-Term (Next 6 Months)
Medium-Term (Next 12-18 Months)
Longer-Term (Beyond 18 Months)
Capital Return Strategy in Detail
Buyback Pace
No Dividend
Authorization Headroom
Hosts, Supply Growth, and Marketplace Health
Supply Story
Host Tools
Marketplace Liquidity
ESG and Stakeholder Considerations
Affordable Housing Tensions
Climate and Sustainability
Trust and Safety
My Final Thoughts
Collection of Latest Analyst Price Targets
Official Sources & Data
Disclaimer: This analysis is for informational & educational purposes only and should not be construed as investment advice. Investors should conduct their own due diligence and consult with their personal financial advisors before making investment decisions. Past performance does not guarantee future results.
Introduction
Airbnb has become the operating system for the world’s largest pool of non-hotel accommodations, and in 2026 it is finally being asked the question every platform business eventually faces: can it sell more than one thing to the same customer?
The Q1 print answered with the strongest growth in more than two years, the highest first-time booker growth since early 2022, and an expanding take rate.
For investors, the story is no longer about a recovery trade off the pandemic lows.
It‘s about whether Airbnb can convert its $30 billion-per-quarter booking platform, $12 billion cash pile, and 60%-AI-coauthored engineering org into a multi-vertical travel super-app before competitors close the gap.
Airbnb Company Profile: Key Facts
Airbnb, Inc. (NASDAQ: ABNB) operates a two-sided online marketplace that connects hosts with guests for stays, experiences, and, since 2025, services. The company is headquartered in San Francisco, was founded in 2007, went public in December 2020, and continues to be led by co-founder and CEO Brian Chesky.
The platform’s reach is global. Airbnb operates in more than 220 countries and regions, supported by 5.5 million-plus hosts who have welcomed over 2.5 billion cumulative guest arrivals.
COMPANY SNAPSHOT  (data as of May 19, 2026)
- Ticker / Exchange:        ABNB / NASDAQ
- Founded:                  2007
- IPO:                      December 10, 2020
- Headquarters:             San Francisco, California
- CEO:                      Brian Chesky (Co-Founder)
- CFO:                      Ellie Mertz
- FY2025 Revenue:           $12.2 billion
- FY2025 Net Income:        $2.5 billion
- FY2025 Adj. EBITDA:       $4.3 billion (35% margin)
- FY2025 Free Cash Flow:    $4.6 billion
- Q1 2026 Cash & Equiv.:    $12.1 billion
- Q1 2026 Buyback Auth.:    $4.5 billion remaining
- Recent Stock Price: ~$134 (May 18, 2026 close)Airbnb Investment Thesis
The Platform Premise
The investment case starts with structural advantages that compound over time. Airbnb sits on the largest aggregated inventory of alternative accommodations on the planet, and that inventory is uniquely fragmented and host-owned, which means the company carries no real estate risk on its balance sheet.
That asset-light footprint allows Airbnb to operate at a 35% Adjusted EBITDA margin while still investing aggressively in product and marketing. By comparison, most asset-heavy hospitality businesses sit in the high single digits to low teens for operating margin.
The core unit of value, however, is the brand. Travelers globally use “Airbnb” as a verb, much like “Google” or “Uber” before it, and roughly 90% of traffic to Airbnb arrives without a paid advertising click.
That direct-traffic moat is rare in online travel, where competitors routinely funnel double-digit percentages of bookings through performance marketing channels.
Why 2026 Matters
The simple version of the 2026 thesis: Airbnb’s growth algorithm finally has three legs instead of one. The first leg is the core homes business, which after years of low-single-digit ADR pricing and modest nights growth has reaccelerated to 18% revenue growth in Q1 2026.
The second leg is geographic expansion outside the five-country core. Origin nights booked in expansion markets such as Brazil, Japan, and India grew at roughly twice the rate of core markets in Q1, and India specifically grew origin nights approximately 50% year-over-year.
The third leg is new products: Services launched in May 2025, Experiences was relaunched in the same release, and a boutique-hotel pilot began in Q4 2025 in New York, Los Angeles, Madrid, and San Francisco. Each of these is small today, but each is potentially a billion-dollar revenue line over the medium term.
Compounding Cash Returns
The fourth, often-underappreciated leg of the thesis is capital return mechanics. Airbnb produced $4.6 billion in free cash flow in FY2025, well in excess of net income because of favorable working capital from guest funds.
That cash is being returned to shareholders almost dollar-for-dollar through buybacks. In FY2025 alone Airbnb retired $3.79 billion of stock, and the Q1 2026 pace of $1.1 billion suggests a similar or higher run-rate this year.
THESIS IN ONE BLOCK
1. Brand-driven direct traffic moat in alternative accommodations.
2. Asset-light platform with 35% Adj. EBITDA margin and >35% TTM FCF margin.
3. Three growth vectors: core, international expansion, new products.
4. Aggressive buybacks reducing share count year after year.
5. AI-led cost leverage in customer support and engineering.Airbnb Business Model Overview
The Two-Sided Marketplace
Airbnb is a classic two-sided platform in which value flows in both directions: hosts list inventory and Airbnb monetizes the connection. The company does not own homes, does not employ hosts, and does not pre-purchase inventory, which makes the model exceptionally capital-efficient.
Hosts grant Airbnb the right to display their listings, manage payments, and provide customer service in exchange for a service fee. Guests book stays, services, or experiences through Airbnb’s website or mobile app, with bookings transacted in a closed-loop payment system that the company controls.
Service Fee Structure
Historically, Airbnb monetized via a split fee: hosts paid a 3% service fee on the booking subtotal, and guests paid a separate service fee that varied based on stay characteristics. The company has been migrating most hosts to a single 15.5% service fee model, with the guest paying a lower or zero separate fee at checkout.
The simplified fee is one of the cleanest structural take-rate levers the company has pulled in years. Management is explicit that the migration to a simplified fee structure and growth in insurance attach should lift the full-year take rate in 2026.
Geographic and Product Mix
Today, the homes business still represents the overwhelming share of Gross Booking Value and revenue. North America remains the largest single region by revenue, while Europe/Middle East/Africa contributes the bulk of nights booked due to high concentration of European demand.
After the 2025 Summer Release, the product mix is broader: Services covers caterers, private chefs, personal trainers, spa, hair, nails, makeup, photography, and massage, while Experiences was rebuilt with curated tiers including Originals and Pathfinders. The boutique-hotel pilot adds professionally managed lodging supply.
How Money Moves Through the Platform
When a guest books a stay, the entire booking amount, including cleaning fees, taxes, and Airbnb’s service fee, is collected at the time of booking and held until the host’s payout date, which is typically 24 hours after guest check-in. The float associated with these guest funds is meaningful.
As of March 31, 2026, Airbnb held $10.6 billion in funds on behalf of guests and $2.7 billion in unearned fees. This float is segregated and not used as operating capital, but the cash and short-term investments balance of $12.1 billion sits separately on the corporate balance sheet.
REVENUE FORMULA  (simplified)
Revenue ≈ Gross Booking Value x Take Rate
Q1 2026: $29.2B GBV x ~9.2% effective take rate ≈ $2.68B revenueAirbnb Revenue Analysis
Long-Term Revenue Trajectory
Airbnb’s revenue base has nearly tripled since 2020, despite the pandemic-era collapse and the subsequent normalization of pent-up demand. From $3.38 billion in FY2020 to $12.2 billion in FY2025, the company has compounded at a high-teens annual rate.
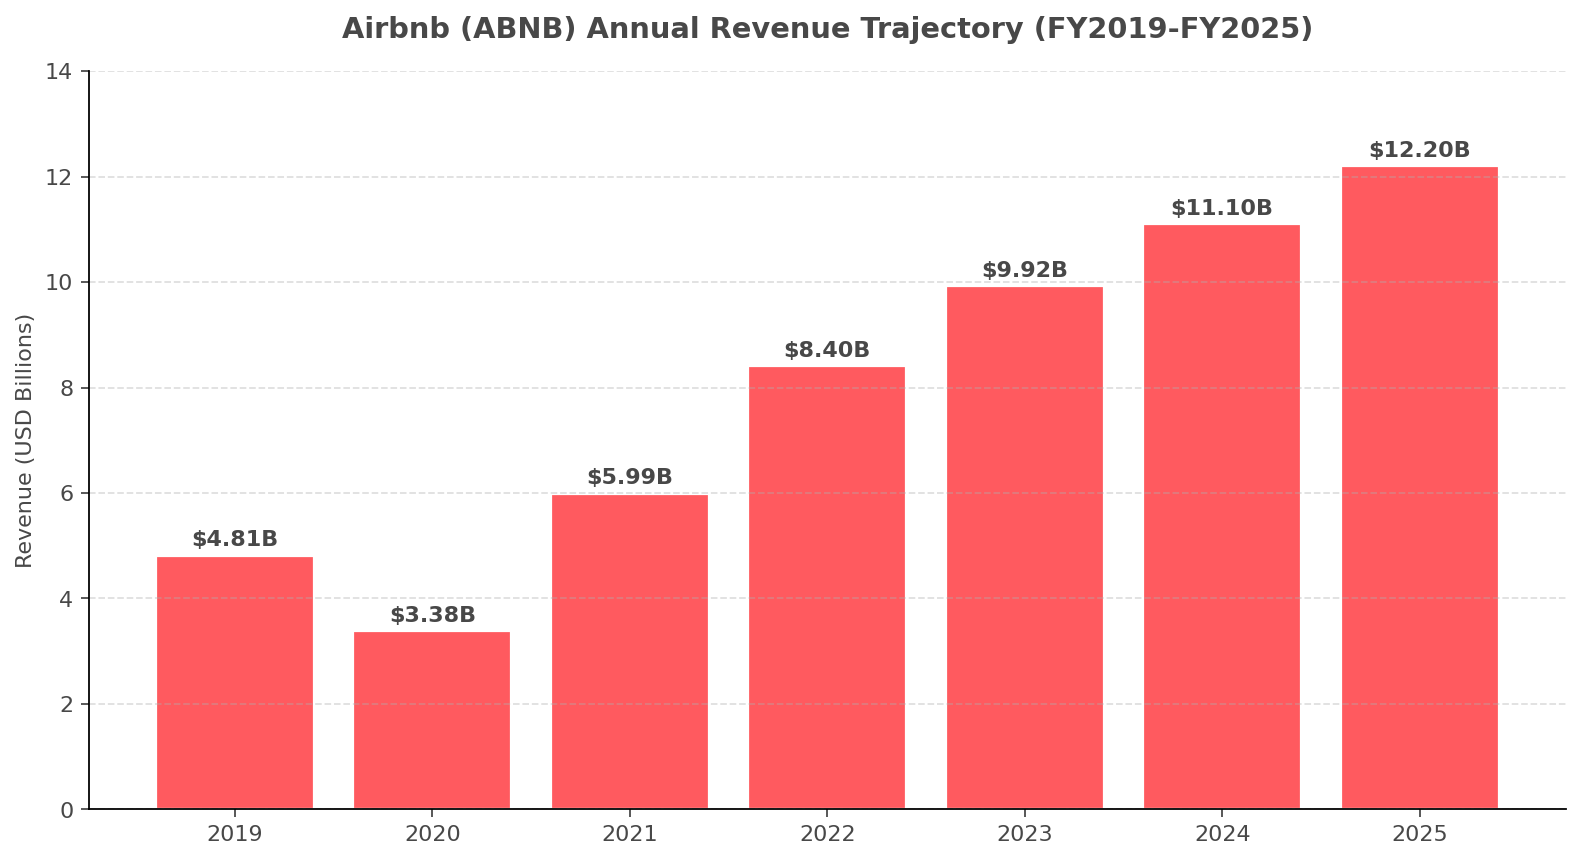
Image source: Deep Research Global analysis, based on Airbnb 10-K filings and shareholder letters for FY2019-FY2025.
The composition of that growth has shifted meaningfully over the period. From 2021 to 2023, growth came overwhelmingly from a rebound in Average Daily Rate as travelers paid up for space, privacy, and longer stays during the post-pandemic period.
From 2024 onward, ADR growth slowed sharply, and the marginal dollar of growth increasingly came from Nights and Experiences Booked rather than from price. That mix shift is healthy because volume growth is a more durable revenue source than pricing.
Q1 2026 Revenue Deep-Dive
Q1 2026 delivered $2.68 billion in revenue, up 18% year-over-year and 15% on a constant-currency basis.
The beat against guidance was driven by stronger-than-expected ADR (a 9% increase versus mid-single-digit expectations) and continued momentum in Nights and Seats Booked, which rose 9% to 156.2 million.
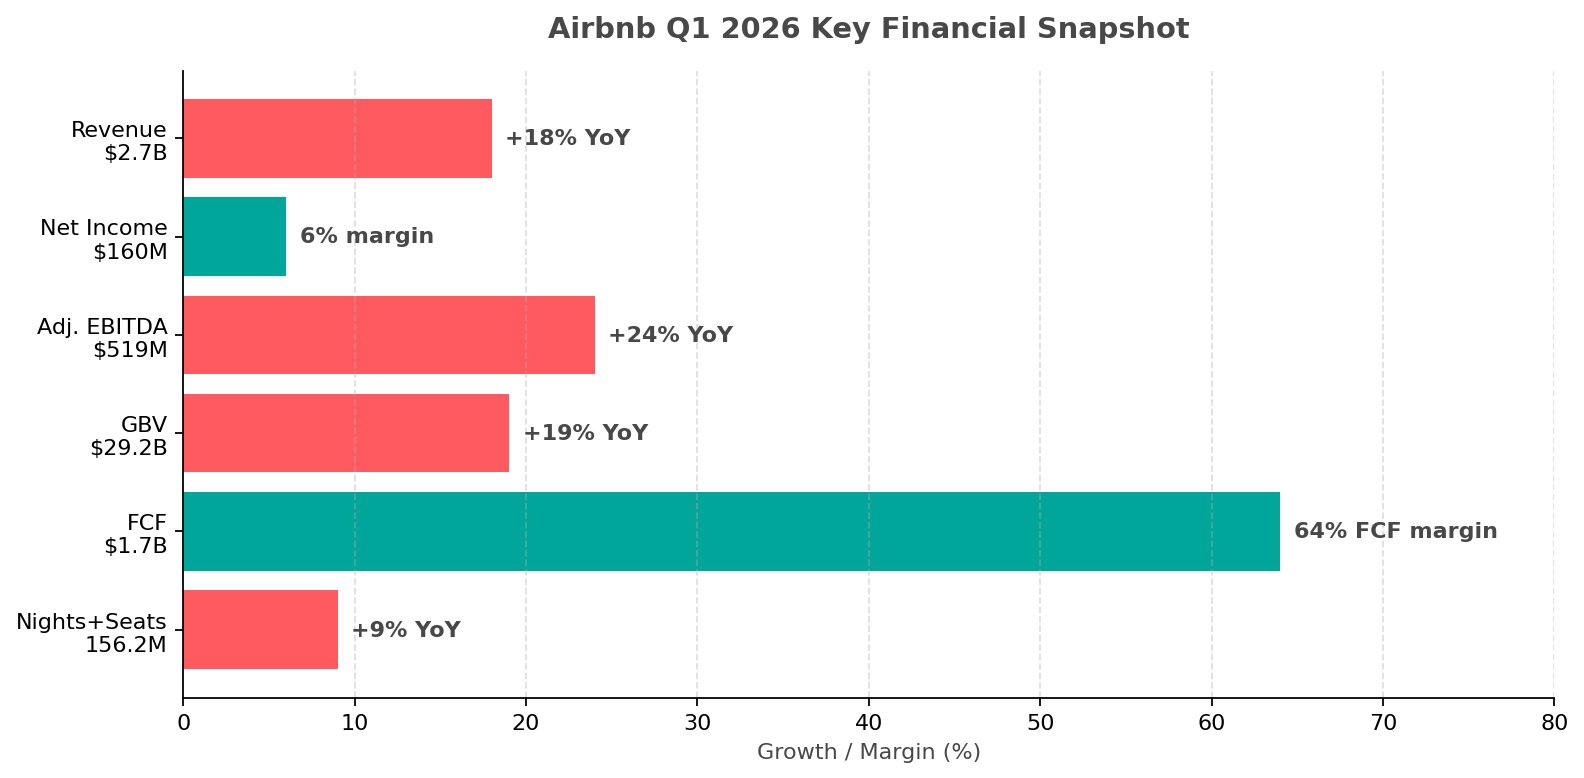
Image source: Deep Research Global analysis, based on Airbnb Q1 2026 Shareholder Letter and 8-K filing.
Gross Booking Value, which measures the dollar value transacted on the platform, reached $29.2 billion in the quarter, a 19% year-over-year increase.
The gap between GBV growth and revenue growth reflects the slight take-rate decline in Q1 from the timing of payments and slightly higher cancellations in EMEA and Asia Pacific.
Quarterly Trends
The quarterly revenue cadence reveals how the business has accelerated through 2025 into 2026. Q4 2025 revenue grew 12% on a tougher comparable, then Q1 2026 stepped up to 18%, the strongest quarter in years.
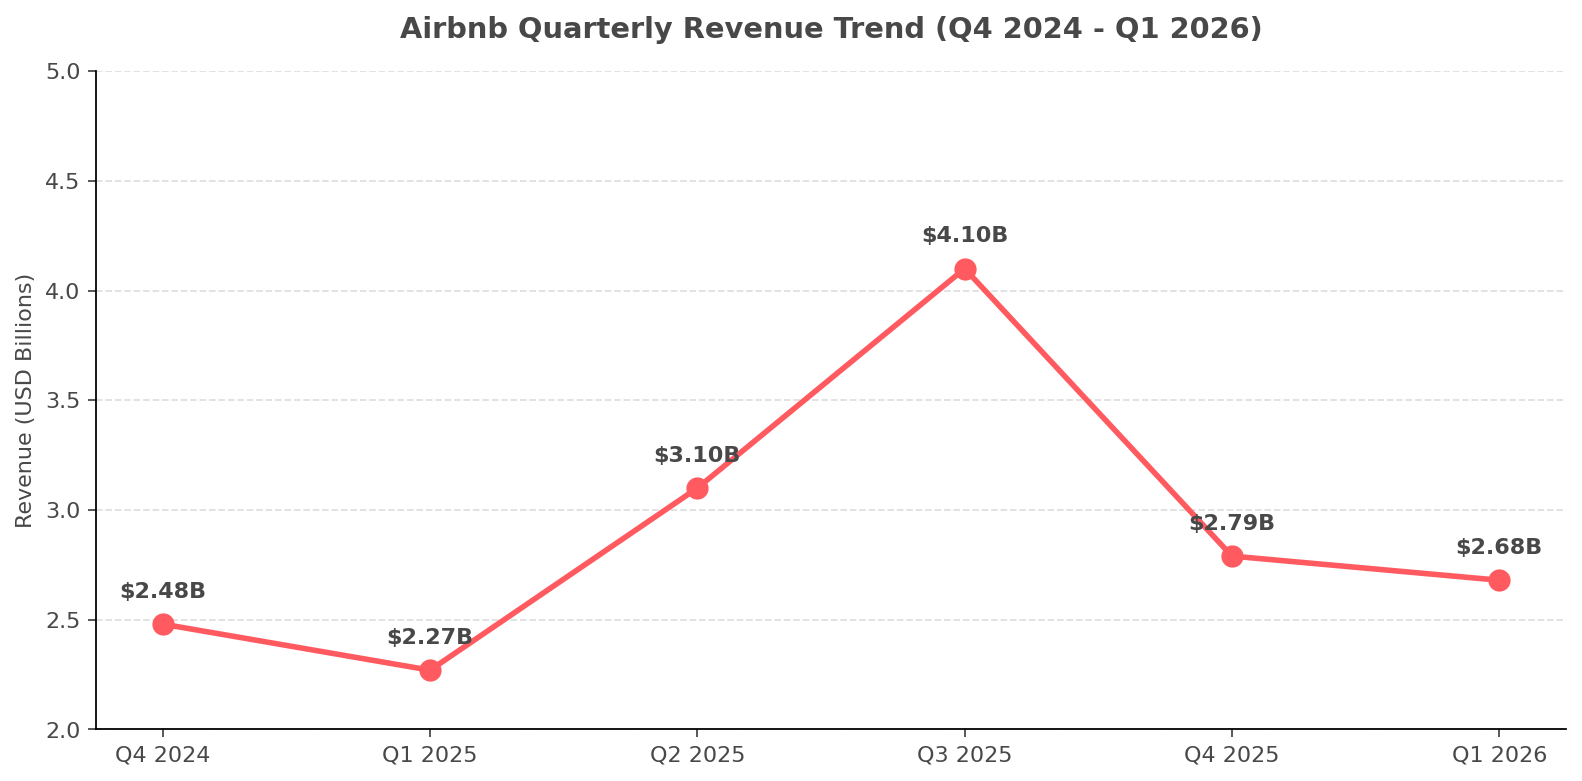
Image source: Deep Research Global analysis, based on Airbnb quarterly shareholder letters.
Importantly, the acceleration is being delivered against the