- Deep Research Global
- Posts
- Apple - Company Analysis and Outlook Report (2026)
Apple - Company Analysis and Outlook Report (2026)
Executive TL;DR
Market Leadership: Apple $AAPL ( ▼ 1.28% ) posted record fiscal 2025 revenue of $416 billion, up 6% YoY, with Services hitting an all-time high of $109.2 billion (up 14%).
Product Cycle Strength: iPhone 17 series driving global market share gains, positioning Apple to become the world’s #1 smartphone manufacturer with 19.4% share in 2025.
AI Integration: Apple Intelligence features rolling out across devices, creating potential catalyst for upgrade cycle acceleration in 2026.
Valuation Premium: Trading at 36.3x P/E and 32.7x forward P/E, representing a premium to historical averages but reflecting strong fundamentals and ecosystem advantages.
Also Read:
Table of Contents
Image source: commons.wikimedia.org
Key Facts: Business Overview
Company Profile
Apple Inc. (NASDAQ: AAPL) designs, manufactures, and markets smartphones, personal computers, tablets, wearables, accessories, and operates a diverse services portfolio.
Headquartered in Cupertino, California, Apple has transformed from a computer manufacturer into the world’s most valuable technology company through vertical integration and ecosystem development.
Revenue Snapshot (LTM Fiscal 2025)
Metric | Value | YoY Change |
|---|---|---|
Total Revenue | $416.16B | +6.4% |
Gross Profit | $195.2B | +8.0% |
Operating Income | $131.6B | +10.8% |
Net Income | $112.0B | +10.5% |
Diluted EPS | $7.36 | +10.2% |
Operating Cash Flow | $128.5B | +6.9% |
Free Cash Flow | $98.8B | -9.2% |
Source: Apple 10-K FY2025
Revenue Drivers by Product Line
Apple’s revenue streams demonstrate diversification beyond hardware, with Services becoming an increasingly critical component.
Product/Service Category | FY2025 Revenue | % of Total | YoY Growth |
|---|---|---|---|
iPhone | $209.6B | 50.3% | +6.0% |
Services | $109.2B | 26.2% | +14.0% |
Mac | $32.5B | 7.8% | +0.4% |
iPad | $29.0B | 7.0% | +8.9% |
Wearables, Home & Accessories | $37.0B | 8.9% | -10.3% |
The iPhone remains Apple’s flagship product but represents a declining share of total revenue as Services grows faster.
Services now generates higher profit margins than hardware and includes the App Store, Apple Music, Apple TV+, Apple Arcade, iCloud, AppleCare, and Apple Pay.
Geographic Revenue Distribution (Q4 2025)
Region | Q4 Revenue | YoY Change | Key Trends |
|---|---|---|---|
Americas | $41.7B | +4.0% | Stable demand |
Europe | $25.4B | +11.0% | Strong growth |
Greater China | $14.5B | -3.6% | Headwinds easing |
Japan | $5.9B | +7.0% | Resilient |
Rest of Asia Pacific | $15.0B | +18.0% | Fastest growth |
China presents both risk and opportunity, with fiscal 2025 revenue declining 3.8% to $64.4B.
However, iPhone 17 series reception suggests a potential turnaround, with IDC forecasting 17% YoY shipment growth in Q4 and 3% full-year 2025 growth.
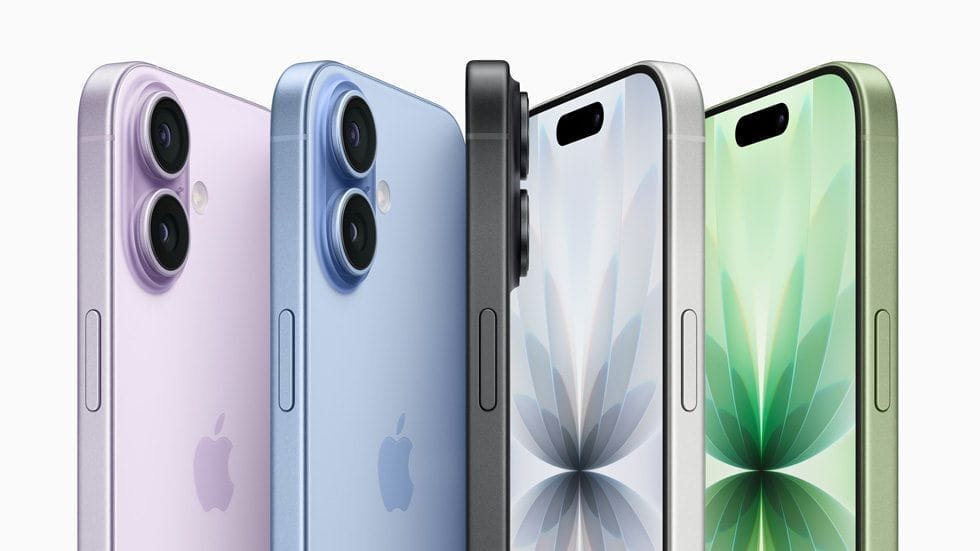
Image source: apple.com
Competitive Analysis and Economic Moat
Porter’s Five Forces Analysis
1. Threat of New Entrants: LOW
Apple’s competitive position benefits from formidable barriers to entry.
Capital Requirements: Developing competitive hardware and software requires billions in R&D investment. Apple spent $34.6B on R&D in FY2025.
Ecosystem Lock-in: Apple’s integrated ecosystem creates switching costs that exceed $10,000 per customer when considering device replacement, data migration, and app repurchases.
Brand Value: Apple’s brand is valued among the world’s most valuable, commanding premium pricing that new entrants cannot match.
Patent Portfolio: Apple holds thousands of patents across hardware, software, and industrial design, creating legal barriers for competitors.
2. Bargaining Power of Suppliers: MODERATE
Apple’s supply chain presents both advantages and vulnerabilities.
Supplier Concentration: While Apple works with multiple suppliers, many critical components come from single or limited sources, particularly advanced semiconductors and display panels.
Volume Leverage: As one of the world’s largest technology purchasers, Apple commands significant negotiating power with suppliers.
Custom Components: Apple increasingly designs proprietary chips (M-series, A-series), reducing dependence on third-party chip designers.
Geographic Risk: Concentration of manufacturing in Asia, particularly China, Taiwan, and Vietnam, creates geopolitical exposure.
3. Bargaining Power of Buyers: MODERATE TO HIGH
Price Sensitivity: While Apple maintains premium positioning, consumers show increasing price sensitivity, particularly in emerging markets.
Low Switching Costs for First-Time Buyers: New customers face minimal barriers when choosing between Apple and competitors.
High Switching Costs for Existing Users: Customer retention rates for iPhone users reached 92% in 2025, demonstrating ecosystem stickiness.
4. Threat of Substitutes: MODERATE
Android Ecosystem: Google’s Android platform powers approximately 72% of global smartphones, offering capable alternatives at various price points.
Platform Convergence: Tablets, laptops, and smartphones increasingly overlap in functionality, creating substitution effects within Apple’s own product line.
Cloud Services: Computing increasingly moves to the cloud, potentially reducing the importance of device hardware over time.
5. Industry Rivalry: HIGH
The smartphone and personal computer markets remain intensely competitive.
Global Smartphone Market:
Manufacturer | Q3 2025 Share | Annual Trend |
|---|---|---|
Samsung | 19.0% | Declining |
Apple | 18.2% | Growing |
Xiaomi | 13.5% | Stable |
Transsion | 9.0% | Growing |
vivo | 8.5% | Growing |
Notably, Counterpoint Research forecasts Apple will surpass Samsung as the world’s #1 smartphone manufacturer by shipments for the first time since 2011, reaching 19.4% market share in 2025.
U.S. Smartphone Market:
Apple dominates its home market with 58.1% share versus 41.6% for Android in 2025.
This domestic strength provides stable cash flow and pricing power.
Competitive Advantages (Economic Moat)
Ecosystem Lock-In
Apple’s integrated ecosystem creates powerful network effects and switching costs.
Device Integration: Seamless connectivity between iPhone, iPad, Mac, Apple Watch, and AirPods creates convenience that’s difficult to replicate.
Services Integration: iCloud, Apple Music, Apple TV+, and other services tie users more deeply into the ecosystem over time.
Data and Content: Photos, messages, app data, and purchased content stored in Apple’s ecosystem create inertia against switching.
Research indicates switching costs reach levels that effectively lock customers into the Apple ecosystem for years.
Apple commands pricing power that competitors cannot match.
The iPhone 17 Pro Max starts at $1,199, while comparable Android flagships sell for $800-$1,000.
Customers pay this premium for perceived quality, status, and ecosystem benefits.
Vertical Integration
Unlike competitors who rely on third-party operating systems, Apple controls the entire stack from silicon to services.
Custom Silicon: M-series and A-series chips deliver performance and efficiency advantages while reducing costs over time.
Operating System Control: iOS, macOS, watchOS, and visionOS are optimized specifically for Apple hardware.
Retail Presence: 513 Apple Stores worldwide provide direct customer relationships and premium service experiences.
Financial Deep Dive
Profitability Analysis
Apple’s margins demonstrate the power of its business model and brand.
Margin Trends (FY2020-2025)
Margin Type | FY2020 | FY2022 | FY2024 | FY2025 | Trend |
|---|---|---|---|---|---|
Gross Margin | 38.2% | 43.3% | 46.2% | 46.9% | ↑ Improving |
Operating Margin | 24.1% | 30.3% | 30.7% | 31.6% | ↑ Improving |
Net Margin | 20.9% | 25.3% | 24.0% | 26.9% | ↑ Improving |
Source: Apple Financial Statements
Gross margin reached a record 46.9% in fiscal 2025, driven primarily by Services growth and improved product mix.
Services carry gross margins exceeding 70%, compared to approximately 35-40% for hardware products.
Free Cash Flow Analysis
Free cash flow generation remains robust despite some recent decline.
FY2025 Free Cash Flow: $98.8B
This represents a 9.2% decline from FY2024’s $108.8B, primarily due to:
Increased capital expenditures for AI infrastructure
Higher working capital requirements
Strategic inventory builds
However, the company still generated $29.7B in operating cash flow in Q4 2025 alone, a September quarter record.
FCF Margin: 23.7% (FCF / Revenue)
FCF Yield: 2.5% (FCF / Market Cap)
These metrics remain healthy, though the FCF yield has compressed due to multiple expansion.
Capital Allocation Strategy
Apple returns substantial capital to shareholders through dividends and buybacks.
Program | Amount | Details |
|---|---|---|
Share Repurchases | $95.0B | Reduced share count by 3.2% |
Dividends Paid | $15.3B | $0.25-$0.26 per share quarterly |
Total Returned | $110.3B | 111% of Free Cash Flow |
Apple announced a $100B buyback authorization in May 2025 and raised its quarterly dividend to $0.26 per share, a 4% increase.
Since 2012, Apple has returned $958 billion to shareholders via dividends and buybacks.
Current Dividend Yield: 0.38%
While the yield remains modest, the dividend has grown consistently and buybacks provide additional shareholder value.
Balance Sheet Strength
Metric | FY2025 | Analysis |
|---|---|---|
Cash & Equivalents | $63.4B | Strong liquidity |
Total Debt | $101.3B | Modest leverage |
Net Cash Position | -$37.9B | Net debt due to low-cost financing |
Current Ratio | 1.05 | Adequate short-term coverage |
Apple maintains a net debt position but benefits from exceptionally low borrowing costs due to its AAA credit quality.
The company views debt as an efficient capital structure tool given interest rates below its return on invested capital.
Valuation Analysis
Current Trading Multiples (January 2026)
Metric | Current | 5-Year Avg | Premium/(Discount) |
|---|---|---|---|
P/E Ratio (TTM) | 36.3x | 28.5x | +27% |
Forward P/E | 32.7x | 26.2x | +25% |
P/S Ratio | 9.8x | 7.2x | +36% |
P/B Ratio | 54.3x | 42.1x | +29% |
EV/EBITDA | 27.8x | 21.4x | +30% |
Source: Yahoo Finance
Apple trades at a significant premium to its historical average, reflecting:
Services mix shift improving margins
AI catalyst expectations
Ecosystem strengthening creating more predictable revenue
Market leadership in premium segments
Peer Comparison
Company | Market Cap | P/E Ratio | Forward P/E | Revenue Growth | Net Margin |
|---|---|---|---|---|---|
Apple (AAPL) | $4.00T | 36.3x | 32.7x | +6.4% | 26.9% |
Microsoft (MSFT) | $3.52T | 34.7x | 30.5x | +16.0% | 35.7% |
Alphabet (GOOGL) | $2.38T | 25.1x | 22.3x | +14.2% | 27.6% |
Amazon (AMZN) | $2.42T | 47.2x | 35.1x | +11.0% | 8.4% |
Meta (META) | $1.89T | 28.4x | 27.0x | +22.1% | 35.5% |
Apple’s valuation sits in the middle of big tech peers on a P/E basis.
The company trades at a premium to Alphabet but discount to Amazon, with Microsoft roughly comparable.
Discounted Cash Flow (DCF) Analysis
Multiple DCF valuations suggest mixed results on current pricing.
Base Case Assumptions:
Revenue CAGR: 6-8% (2026-2030)
Terminal Growth: 3.0%
WACC: 8.5%
FCF Margin: 22-24%
DCF Intrinsic Value Estimates:
Source | Intrinsic Value | Current Price | Implied Return |
|---|---|---|---|
$209.60 | $271.01 | -22.7% | |
$139.01 | $271.01 | -48.7% | |
$185.00 | $271.01 | -31.7% | |
Bull Case | $290.00 | $271.01 | +7.0% |
Most conservative DCF models suggest Apple trades above intrinsic value, while bull case scenarios (assuming AI-driven acceleration) support current or higher prices.
Sensitivity Analysis
Key Variables Impact on Valuation:
Variable | -20% Change | Base Case | +20% Change |
|---|---|---|---|
Revenue Growth | $185 | $210 | $238 |
FCF Margin | $178 | $210 | $245 |
Terminal Growth | $188 | $210 | $235 |
WACC | $245 | $210 | $182 |
Valuation proves most sensitive to cost of capital assumptions and terminal growth rates.
Catalysts and Timeline
Near-Term Catalysts (Q1-Q2 2026)
iPhone 17 Cycle Momentum (Q1 2026)
Early indications suggest strong demand for the iPhone 17 series, particularly the new iPhone Air variant.
If this momentum continues through the holiday quarter, it could drive upside to revenue estimates.
Apple Intelligence Rollout (Ongoing)
Apple Intelligence features continue expanding across devices and languages, potentially accelerating upgrade cycles.
Key features include AI-powered writing tools, enhanced Siri, image generation, and smart prioritization across apps.
Services Growth Acceleration (Q1-Q2 2026)
Services revenue hit $28.75B in Q4 2025, up 15% YoY.
Continued momentum could drive 2026 Services revenue above $120B.
China Market Stabilization (Q1 2026)
After years of headwinds in China, iPhone 17 reception suggests potential stabilization or modest recovery.
Medium-Term Catalysts (2026-2027)
Vision Pro Gen 2 Launch (2026)
Despite weak first-generation sales (IDC estimates only 45,000 Q4 2025 shipments), Apple typically improves significantly with second-generation products.
A more affordable model or enhanced features could expand the market.
Apple Car or Major New Category (TBD)
While timelines remain uncertain, Apple has significant resources to enter new product categories.
Historical patterns suggest major new categories emerge every 4-7 years (iPhone 2007, iPad 2010, Watch 2015, Vision Pro 2025).
AI Services Monetization (2026-2027)
Apple could introduce premium AI features as part of Apple One bundles or standalone subscriptions.
This would monetize the significant AI infrastructure investments.
Long-Term Catalysts (2027+)
Healthcare Expansion
Apple Watch and other devices collect substantial health data.
Regulatory clearances for additional health monitoring features could open healthcare services opportunities.
Financial Services Growth
Apple Pay, Apple Card, and potential expansion into additional financial products could significantly expand Services revenue.
The company has largely untapped opportunities in insurance, lending, and wealth management.
Emerging Markets Penetration
India represents a major growth opportunity with 1.4 billion people and rising smartphone adoption.
Apple is expanding manufacturing in India and could see significant volume growth even at lower ASPs.
Key Risks Analysis
High Probability Risks (>40% Likelihood)
1. China Geopolitical Risk (Probability: 60%)
Nature of Risk: Escalating U.S.-China tensions could result in restrictions on Apple’s ability to manufacture in or sell to China.
Potential Impact: Greater China represents 15.5% of revenue ($64.4B in FY2025).
Severe restrictions could impact both revenue and manufacturing capabilities.
Manufacturing concentration in China creates supply chain vulnerability.
Mitigation: Apple is diversifying manufacturing to India and Vietnam, but this process takes years.
The company is also developing capabilities in other Asian countries.
2. Regulatory and Antitrust Pressure (Probability: 70%)
Nature of Risk: Regulators in the EU, U.S., and other jurisdictions target Apple’s App Store policies, privacy practices, and ecosystem control.
Potential Impact: The EU found Apple in breach of the Digital Markets Act and imposed fines.
Forced changes to App Store policies could reduce Services revenue by 5-15%.
DOJ antitrust investigations in the U.S. could result in structural changes.
Mitigation: Apple is adapting policies to comply with regulations while preserving business model elements where possible.
3. Smartphone Market Saturation (Probability: 50%)
Nature of Risk: Global smartphone markets mature, extending replacement cycles beyond 3-4 years.
Potential Impact: iPhone revenue growth could slow to low single digits or decline in units sold.
This would increase pressure on Services and other categories to drive growth.
Mitigation: Apple Intelligence and other AI features aim to accelerate upgrade cycles.
Services growth partially offsets hardware saturation.
Moderate Probability Risks (20-40% Likelihood)
4. Supply Chain Disruption (Probability: 35%)
Nature of Risk: Natural disasters, geopolitical events, or pandemics disrupt manufacturing or component supply.
Potential Impact: Revenue delays, margin pressure, and market share loss if competitors maintain supply.
Semiconductor shortages in 2021-2022 demonstrated vulnerability.
Mitigation: Diversification of suppliers and geographic manufacturing footprint reduces concentration risk.
Apple’s scale provides priority access to constrained components.
5. AI Competition Acceleration (Probability: 30%)
Nature of Risk: Competitors (Google, Samsung, Chinese OEMs) deliver superior AI experiences faster than Apple.
Potential Impact: Market share loss and pressure on premium pricing if AI advantages erode.
Android’s larger market share could attract better third-party AI integration.
Mitigation: Apple’s vertical integration allows optimization others cannot match.
Ecosystem lock-in provides time to catch up even if initially behind.
Lower Probability, High Impact Risks (<20% Likelihood)
6. Cybersecurity Breach (Probability: 15%)
Nature of Risk: Major breach of iCloud, Apple ID, or device security compromising customer data.
Potential Impact: Severe reputation damage, regulatory fines, and loss of trust in ecosystem security.
Apple’s privacy positioning makes this particularly damaging.
Scenario Impact: $50-100B market cap loss, multi-year recovery period.
7. Key Person Risk (Probability: 10%)
Nature of Risk: Loss of CEO Tim Cook or other critical executives through departure or health issues.
Potential Impact: Uncertainty and potential strategy shifts could impact stock performance.
Historical precedent (Steve Jobs’ death) showed market concerns.
Mitigation: Deep management bench with long-tenured executives reduces dependence on any single person.
SEC Filings
Form 10-K FY2025 (October 31, 2025)
Form 8-K Q4 2025 Earnings (October 30, 2025)
Form 10-Q Q3 2025 (July 31, 2025)
All SEC filings available at Apple Investor Relations.
Earnings Transcripts
Q4 2025 Earnings Call Transcript (October 30, 2025)
Management provided guidance for Q1 2026 during the call
Official Company Data
Apple Newsroom for product announcements and quarterly results
Apple Investor Relations for financial data and shareholder information
Form 10-K FY2025 for comprehensive business disclosures
Third-Party Research
SWOT Analysis
Strengths
Strength | Impact | Sustainability |
|---|---|---|
Ecosystem Lock-In | 92% customer retention rate creates predictable revenue | High - switching costs increase over time |
Brand Premium | Commands 20-30% pricing premium vs. competitors | High - brand equity built over decades |
Services Growth | 14% YoY growth with 70%+ margins | High - recurring revenue model |
Capital Efficiency | $98.8B FCF enables shareholder returns | High - scale advantages persist |
Vertical Integration | Custom silicon delivers performance advantages | High - competitors cannot easily replicate |
Weaknesses
Weakness | Impact | Addressability |
|---|---|---|
China Dependence | 15.5% of revenue from geopolitically sensitive market | Medium - diversification underway but slow |
Manufacturing Concentration | Supply chain risk from Asia concentration | Medium - Vietnam and India expansion ongoing |
Limited Market Share | Minority position in global smartphone market | Low - premium positioning limits addressable market |
Mature Product Categories | iPhone, iPad growth constrained by saturation | Medium - AI features may extend cycles |
Vision Pro Struggles | Only 45,000 Q4 units sold, weak category entry | High - early stage, typical Apple improvement trajectory |
Opportunities
Opportunity | Potential Impact | Timeline |
|---|---|---|
AI Services Monetization | $10-20B revenue opportunity from premium AI features | 2026-2028 |
India Market Growth | 10-15% revenue growth as middle class expands | 2026-2030 |
Healthcare Services | $50-100B TAM in health monitoring and services | 2027-2032 |
Financial Services Expansion | Apple Pay, Card, potential insurance products | 2026-2029 |
Emerging Product Categories | AR glasses, home robots, automotive | 2027-2035 |
Threats
Threat | Likelihood | Potential Impact |
|---|---|---|
Antitrust Actions | High | $10-50B revenue impact from App Store changes |
China Restrictions | Medium | $30-100B revenue risk from manufacturing or market loss |
AI Competition | Medium | Market share erosion if competitors deliver superior AI |
Economic Recession | Medium | 10-20% revenue decline in severe downturn |
Cybersecurity Breach | Low | Severe reputation damage, multi-year recovery |
PESTEL Analysis
Political Factors
U.S.-China Relations: Deteriorating relationship creates tariff risks and manufacturing constraints.
New tariffs announced in Q2 2025 on imports from China, Vietnam, India, and other key manufacturing centers could increase costs 10-25%.
Antitrust Scrutiny: Increased regulatory focus in EU and U.S. targets App Store and ecosystem practices.
Data Localization: Requirements to store data locally in various countries increase operational complexity and costs.
Economic Factors
Inflation and Interest Rates: Higher rates increase capital costs and reduce consumer discretionary spending.
Currency Fluctuations: Strong dollar pressures international revenue and margins.
Consumer Spending: Premium product positioning makes Apple more sensitive to economic downturns than value competitors.
Privacy Consciousness: Growing consumer awareness of data privacy aligns with Apple’s positioning.
Sustainability Expectations: Consumers increasingly expect environmental responsibility in supply chains.
Apple committed to carbon neutrality by 2030.
Screen Time Concerns: Social backlash against excessive device usage could limit growth.
Technological Factors
AI Revolution: Generative AI and machine learning reshape competitive dynamics.
Apple Intelligence represents the company’s response.
5G/6G Deployment: Network infrastructure improvements enable new services and use cases.
Semiconductor Advances: Moore’s Law slowdown increases difficulty of maintaining performance advantages.
Environmental Factors
Climate Change Regulation: Carbon taxes and environmental regulations impact supply chain costs.
Resource Scarcity: Rare earth elements and water resources face supply constraints.
E-Waste Concerns: Product lifespan and recyclability face increasing scrutiny.
Legal Factors
Intellectual Property: Patent disputes and licensing negotiations ongoing with competitors.
Labor Practices: Supplier working conditions face scrutiny despite code of conduct.
Right to Repair: Legislation in multiple jurisdictions could impact service revenue.
Latest Analyst Price Targets (January 2026)
Analyst/Firm | Price Target | Rating | Date | Key Thesis |
|---|---|---|---|---|
Dan Ives (Wedbush) | $350 | Outperform | Dec 2025 | |
Morgan Stanley | $315 | Overweight | Dec 2025 | |
Average Target | $284 | Jan 2026 | Based on 37 analyst consensus | |
High Target | $350 | Bullish AI adoption scenario | ||
Low Target | $218 | Conservative/bear case | ||
Median Target | $283 | Middle estimate |
Consensus Recommendation: 73% Buy/Outperform, 24% Hold, 3% Sell/Underperform
Implied Upside: +4.8% to average target from current price of $271
Key points from analyst community:
iPhone 17 cycle strength exceeds expectations
Services growth remains underappreciated
AI monetization potential not fully reflected in estimates
Valuation premium justified by ecosystem and margin expansion
China recovery critical but uncertain
My Final Thoughts
Apple stands at an inflection point entering 2026.
The company delivered record fiscal 2025 results with $416 billion in revenue and positioned itself to become the world’s #1 smartphone manufacturer for the first time in over a decade.
Services reached $109 billion with accelerating growth and margins exceeding 70%.
For long-term investors, Apple’s competitive advantages remain formidable.
The ecosystem lock-in creates 92% customer retention, while the shift toward Services generates increasingly predictable high-margin revenue.
Free cash flow of $98.8 billion funds substantial shareholder returns while maintaining fortress balance sheet strength.
However, current valuation demands scrutiny.
Trading at 36.3x earnings represents a 27% premium to five-year averages, with most DCF models suggesting fair value between $185-210.
The bull case rests heavily on AI-driven upgrade cycles and Services acceleration materializing faster than currently reflected in estimates.
Three critical factors will determine 2026 performance: China market trajectory following iPhone 17 reception; regulatory outcomes in the EU and U.S. on antitrust matters; and the pace of Apple Intelligence adoption driving device upgrades.
For investors with long-term horizons and tolerance for valuation risk, Apple’s combination of cash generation, capital allocation, and ecosystem durability justify holding current positions.
The company has consistently rewarded patient shareholders and maintains the resources to navigate challenges.
New investors should consider the premium valuation and potential for multiple compression.
Entry points below $250 would offer more attractive risk-reward profiles, while prices above $280 leave limited margin of safety if growth disappoints.
The smartphone market maturation, combined with Vision Pro’s weak start, reminds us that even Apple faces limits to growth.
Ultimately, Apple remains a world-class business trading at a full but not outrageous valuation.
The ecosystem moat, Services momentum, and capital return commitment support a constructive outlook.
But investors must balance enthusiasm for AI catalysts with realistic assessments of maturity, competition, and regulatory headwinds.
Disclaimer: This analysis is for informational purposes only and should not be construed as investment advice. Investors should conduct their own due diligence and consult with financial advisors before making investment decisions.

Reply