
Marriott International (MAR) - Fundamental Analysis Report 2026 (Updated)

Dear Readers, Welcome to Deep Research Global.
Let’s analyze the topic in detail.
Executive TL;DR
Marriott International (MAR) just printed a strong Q1 2026 with worldwide RevPAR up 4.2%, gross fee revenues up 12% to $1.43 billion, and Adjusted EBITDA of $1,398 million, 15% above the prior-year quarter and well ahead of the company’s own first-quarter guide.
The development engine is at a record. The pipeline ended Q1 2026 at over 4,100 properties and nearly 618,000 rooms, of which 43% are already under construction or in conversion, supporting 4.5% to 5% net unit growth in 2026.
Capital returns are accelerating, with management targeting over $4.3 billion of capital returns in 2026 through dividends and buybacks, on top of more than $4.0 billion returned in 2025.
Marriott Bonvoy, now at nearly 283 million members, is the wide moat of this business, anchoring an asset-light, fee-driven model whose 2026 Adjusted EBITDA is guided to grow 8% to 10% year over year.
Table of Contents
Executive TL;DR
Introduction
Marriott International Company Profile: Key Facts
Why Marriott Matters in 2026
Marriott International Investment Thesis
Pillar 1
Pillar 2
Pillar 3
Pillar 4
Pillar 5
Marriott International Business Model Overview
How the Platform Earns Money
Owned, Leased, and Other Revenue
Cost Reimbursements
Owner Alignment as a Competitive Weapon
Marriott International Revenue Analysis
Headline Revenue Numbers
The Fee Engine Inside the Top Line
RevPAR Growth and Regional Mix
Co-Branded Credit Card and Other Non-RevPAR Fees
Net Unit Growth as a Compounding Force
Latest Quarterly Earnings and 2026 Guidance
Q1 2026 Earnings Recap
Full-Year 2026 Guidance
Management Tone on the Call
Margins and Earnings Quality
Underlying Fee Margins
Earnings Quality
The G&A Trajectory
EPS Trajectory and Per-Share Mechanics
EPS by the Year
Buyback Mechanics
Tax-Related Noise in EPS
Cash Flow Mechanics
Operating Cash Flow
Capital Expenditures
Free Cash Flow
Balance Sheet Health
Debt Levels
Interest Expense
Leverage Discipline
Credit Quality
Segment-by-Segment Teardown
Luxury
Premium
Select-Service
Midscale
Longer Stays
Collections and Outdoor
Geographic Mix
Strategic and Competitive Context
The Big Three Branded Operators
Lifestyle and Boutique Competition
Alternative Accommodation Risk
China and APAC Competition
Online Travel Agencies
The Bonvoy Flywheel: A Deeper Look
Scale
Economics
Partnerships
Risks
Technology and Digital Transformation
AI and Agentic Commerce
Cybersecurity Discipline
Data and Personalization
Valuation Framework
Adjusted EBITDA Multiple
P/E on Forward Adjusted EPS
Free Cash Flow Yield
What Investors Are Really Paying For
Comparison to Peers
Bull, Base, and Bear Case Scenarios
Bull Case
Base Case
Bear Case
Key Risks for Marriott Investors
Risk 1
Risk 2
Risk 3
Risk 4
Risk 5
Risk 6
Risk 7
Catalysts to Watch in 2026 and 2027
Quarterly RevPAR Acceleration
Net Unit Growth and Conversions
Buyback Pace
New Brand Scale-Up
Branded Residences Expansion
Technology Platform Migration
Macro Recovery in EMEA
Capital Allocation Discipline
Dividend Policy
Buyback Strategy
M&A Discipline
Reinvestment in Technology and Brands
ESG and Sustainability Profile
Climate
Social
Governance
How to Track Marriott Going Forward
How the Pieces Fit Together
My Final Thoughts
Latest Analyst Price Targets
Official Sources and Data
Disclaimer: This analysis is for informational & educational purposes only and should not be construed as investment advice. Investors should conduct their own due diligence and consult with their personal financial advisors before making investment decisions. Past performance does not guarantee future results.
Introduction
Marriott International runs the world’s largest hotel system by rooms, yet it owns almost none of those buildings.
That contradiction is the single most important thing investors need to understand about MAR, and it explains why a 4% RevPAR quarter can translate into a 15% jump in Adjusted EBITDA.
This report unpacks the fundamentals as of 2026: the cash flow mechanics, the brand stack from Ritz-Carlton to Four Points Flex, the Bonvoy flywheel, the balance sheet trade-offs, and the bull, base, and bear scenarios that matter most to long-term holders.

Marriott International Company Profile: Key Facts
Marriott is the parent of one of the most recognizable rosters of hotel brands in the industry, with global headquarters in Bethesda, Maryland. The company operates, franchises, and licenses hotel, residential, timeshare, and other lodging properties across six continents.
The scale is best understood in numbers rather than adjectives. Marriott crossed the 9,900-property mark during Q1 2026 and its system now houses nearly 1.796 million rooms across the globe.
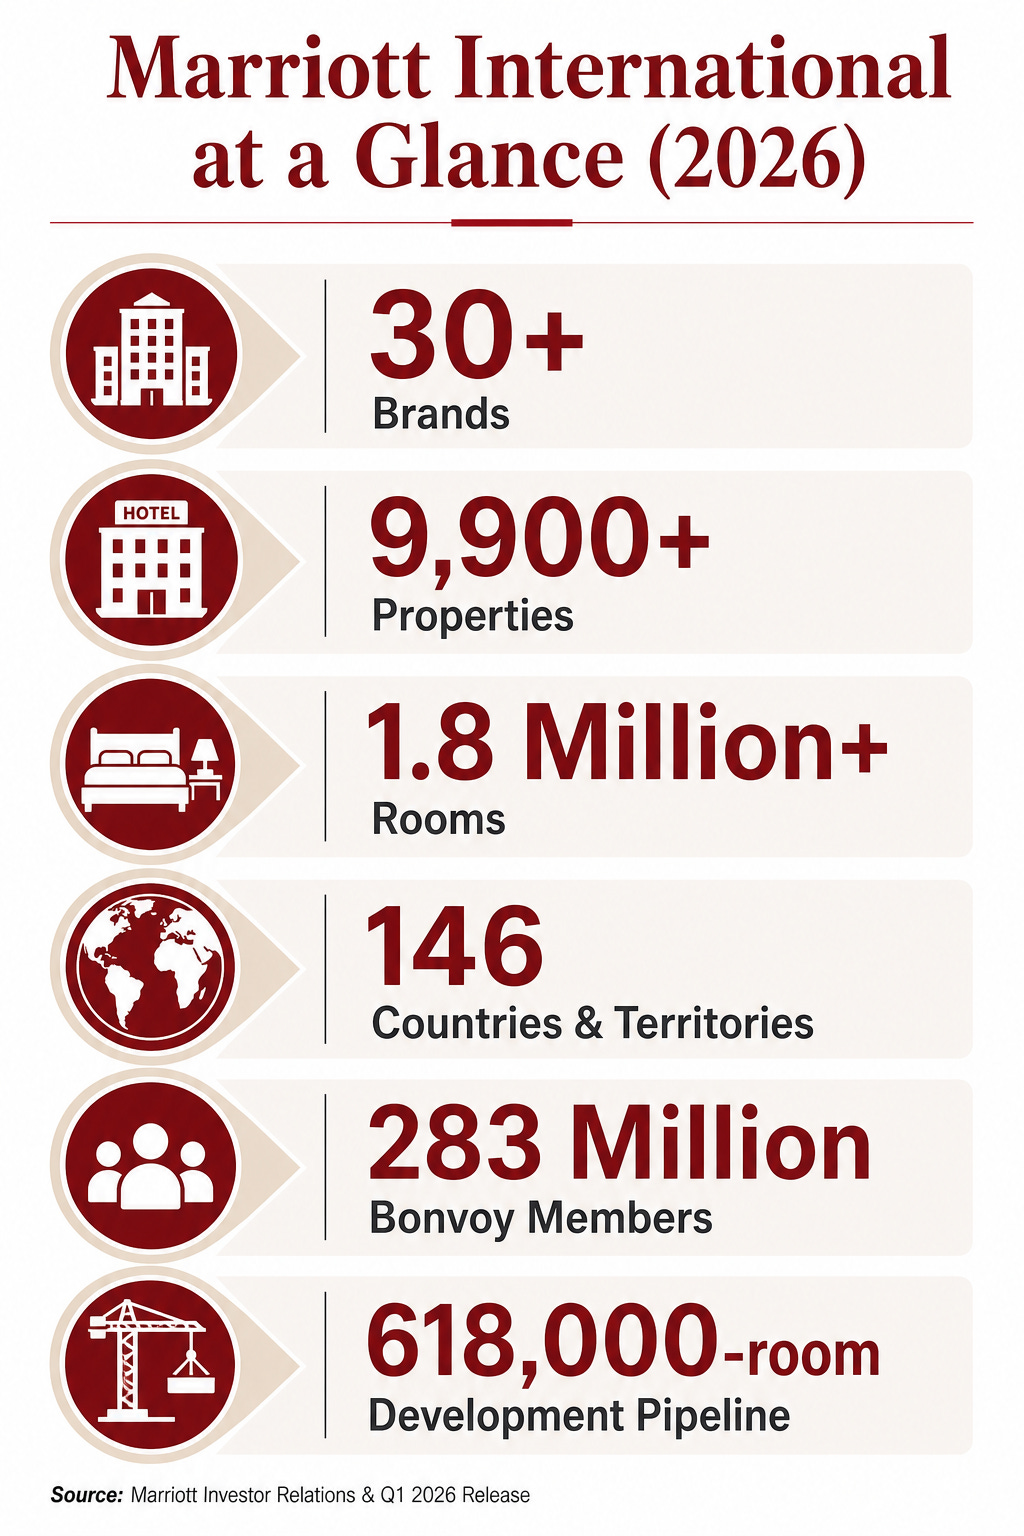
Image source: Deep Research Global analysis, based on Marriott Investor Relations and Q1 2026 earnings release.
The company is structured around an asset-light fee engine. Management and franchise fees are the primary source of profit, while owned and leased real estate represents only a small fraction of revenues and capital intensity.
COMPANY SNAPSHOT (Q1 2026)
-----------------------------------------
Ticker / Exchange       : MAR / Nasdaq
Headquarters            : Bethesda, Maryland, USA
President & CEO         : Anthony Capuano
Founded                 : 1927 (J. Willard Marriott)
Properties              : ~9,900
Rooms                   : ~1,796,000
Brands                  : 30+
Countries & Territories : 146
Bonvoy Members          : ~283 million
Development Pipeline    : ~618,000 rooms
FY2025 Revenue          : $26.186 billion
FY2025 Adjusted EBITDA  : $5.383 billion
FY2025 Adjusted EPS     : $10.02 (diluted)
The chief executive, Anthony Capuano, stepped into the top job in 2021 after running global development. He was named the 2026 Cornell Hospitality Icon, and is now five years into a tenure defined by aggressive midscale expansion, technology modernization, and a record signings pace.
The Marriott family still holds a meaningful equity position through descendants of J. Willard Marriott and the late chairman J.W. “Bill” Marriott Jr., which is a small but useful alignment factor for long-term investors.
Why Marriott is Relevant in 2026
The hotel industry is going through a structural shift in which the asset-heavy ownership model is steadily losing share to large, branded platforms that monetize distribution, loyalty, and technology rather than real estate.
Marriott sits at the center of that shift.
Its Marriott Bonvoy travel platform is the largest hotel loyalty program in the world, its development pipeline is a record, and roughly 90% of its system revenue is derived from fees on hotels it does not own.
That’s the key in short. This analysis report explains why that shift is durable and where the risks live.
Marriott International Investment Thesis
The Marriott investment thesis rests on five interconnected pillars: asset-light economics, a record development pipeline, a 283-million-strong loyalty network, accelerating fee mix, and disciplined capital return.
Pillar 1: Asset-Light, Fee-Driven Economics
The vast majority of Marriott’s economic value is captured through fees, not bricks. Franchise fees, base management fees, incentive management fees, and credit card licensing royalties drove gross fee revenues to roughly $1.43 billion in Q1 2026, a 12% year-over-year increase.
This structure means RevPAR translates into fee revenue with significant operating leverage. A 1% move in worldwide RevPAR typically passes through to fees with very little incremental cost.
WHY ASSET-LIGHT MATTERS
-----------------------------------------
- Capex stays light. Most properties are
  financed and owned by third-party owners.
- Margins are high. Incremental fee dollars
  carry very high contribution margins.
- Capital can be returned to shareholders.
- Cycle exposure is dampened versus an
owner-operator like a hotel REIT.Pillar 2: A Record Development Pipeline
At the end of Q1 2026, the development pipeline reached over 4,100 properties and nearly 618,000 rooms. Crucially, 43% of those pipeline rooms are already under construction or in the process of conversion, which is a leading indicator of future fee revenue.
Conversions, where existing third-party hotels move under a Marriott flag, represented over 35% of Q1 2026 signings. Around 75% of 2025’s conversion openings occurred within twelve months of signing, which compresses the typical hotel cycle of “sign now, earn fees in three to five years.”
Pillar 3: The Bonvoy Flywheel
The Marriott Bonvoy program had nearly 283 million members at Q1 2026, up from 271 million at year-end 2025 and over 219 million at year-end 2023.
That is a flywheel because loyalty members book direct on Marriott channels, which reduces owner distribution costs, which makes Marriott more attractive to owners, which expands the network, which makes the loyalty program more attractive to travelers.
The co-branded credit card economics are particularly powerful. Higher co-branded credit card fees were called out as a primary driver of the 13% jump in franchise and base management fees in Q1 2026.
Pillar 4: Accelerating Fee Mix Toward Higher Quality Revenue
The composition of Marriott’s fee stream is improving. Incentive management fees, which scale with hotel profitability rather than just revenue, reached $222 million in Q1 2026 against $204 million in the prior-year quarter.
International hotels contributed nearly two-thirds of incentive fees in the quarter, which is meaningful because the U.S. business is more typically franchised while international markets skew toward management contracts.
Pillar 5: Disciplined Capital Return
Marriott has been a return-of-capital machine. The company returned over $4.0 billion to shareholders in 2025, and management has guided to more than $4.3 billion in 2026 through dividends and share repurchases.
Year-to-date through April 29 of 2026, the company had already returned over $1.2 billion. Share count is shrinking, with shares outstanding dropping from roughly 274 million at year-end 2025 to about 268 million by May 2026.
INVESTMENT THESIS IN ONE SCREEN
-----------------------------------------
1. Asset-light fee economics
2. Record pipeline supporting 4.5%-5% NUG
3. 283M Bonvoy loyalty members
4. Accelerating high-quality fee mix
5. $4.3B+ targeted capital returns in 2026
Marriott International Business Model Overview
Marriott’s business model is best understood as a platform that connects three groups: travelers, hotel owners, and brand experiences.
How the Platform Earns Money
The company earns money in three main ways: franchise fees from licensed hotels, management fees from managed hotels, and a smaller stream from owned, leased, and other operations.
In Q1 2026, franchise and base management fees totaled $1,211 million, a 13% year-over-year increase, driven by higher co-branded credit card fees, rooms growth, and stronger RevPAR.
Incentive management fees, which are typically a percentage of a managed hotel’s profits over a threshold, contributed an additional $222 million in the quarter.
Owned, Leased, and Other Revenue
Owned, leased, and other revenue net of expense was $35 million in Q1 2026 versus $29 million in the prior-year period. The number is intentionally small because Marriott deliberately runs an asset-light model.
The company occasionally takes minority positions or short leases to seed new brands or markets, but the strategic intent is always to recycle capital out of real estate and into platform investments.
Cost Reimbursements
A large piece of the income statement is “cost reimbursement revenue” and “reimbursed expenses.” These are typically near-zero on a net basis because Marriott collects them from owners and pays them out for operating the hotel.
Investors should mostly ignore cost reimbursement lines for valuation purposes and focus instead on fee revenue, owned/leased net, general and administrative expense, and incentive fees.
Owner Alignment as a Competitive Weapon
The asset-light model only works if hotel owners want a Marriott flag on their building. Owners care about three things: room nights, rate, and net operating income.
Marriott’s pitch is that Bonvoy delivers occupancy, distribution scale delivers rate, and operating systems deliver margin. The company’s growth in midscale through Four Points Flex by Sheraton, City Express, and StudioRes is a clear signal that owners across price tiers want exposure to the platform.
THE THREE OWNER PROMISES
-----------------------------------------
1. Bonvoy demand. ~283M loyalty members
   funneling direct bookings to your hotel.
2. Distribution scale. Lower cost of
   capture vs. independent or smaller chains.
3. Brand consistency and operating tools.
Marriott International Revenue Analysis
Top-line growth at Marriott looks modest at first glance but tells a very different story when you peel back the layers.
Headline Revenue Numbers
Full-year 2025 total revenues were $26,186 million, with full-year worldwide RevPAR up 2.0% and net rooms up more than 4.3%. Q1 2026 revenue came in at $6.654 billion, beating consensus.
The chart below visualizes the steady upward grind in both revenue and Adjusted EBITDA over the last three fiscal years.
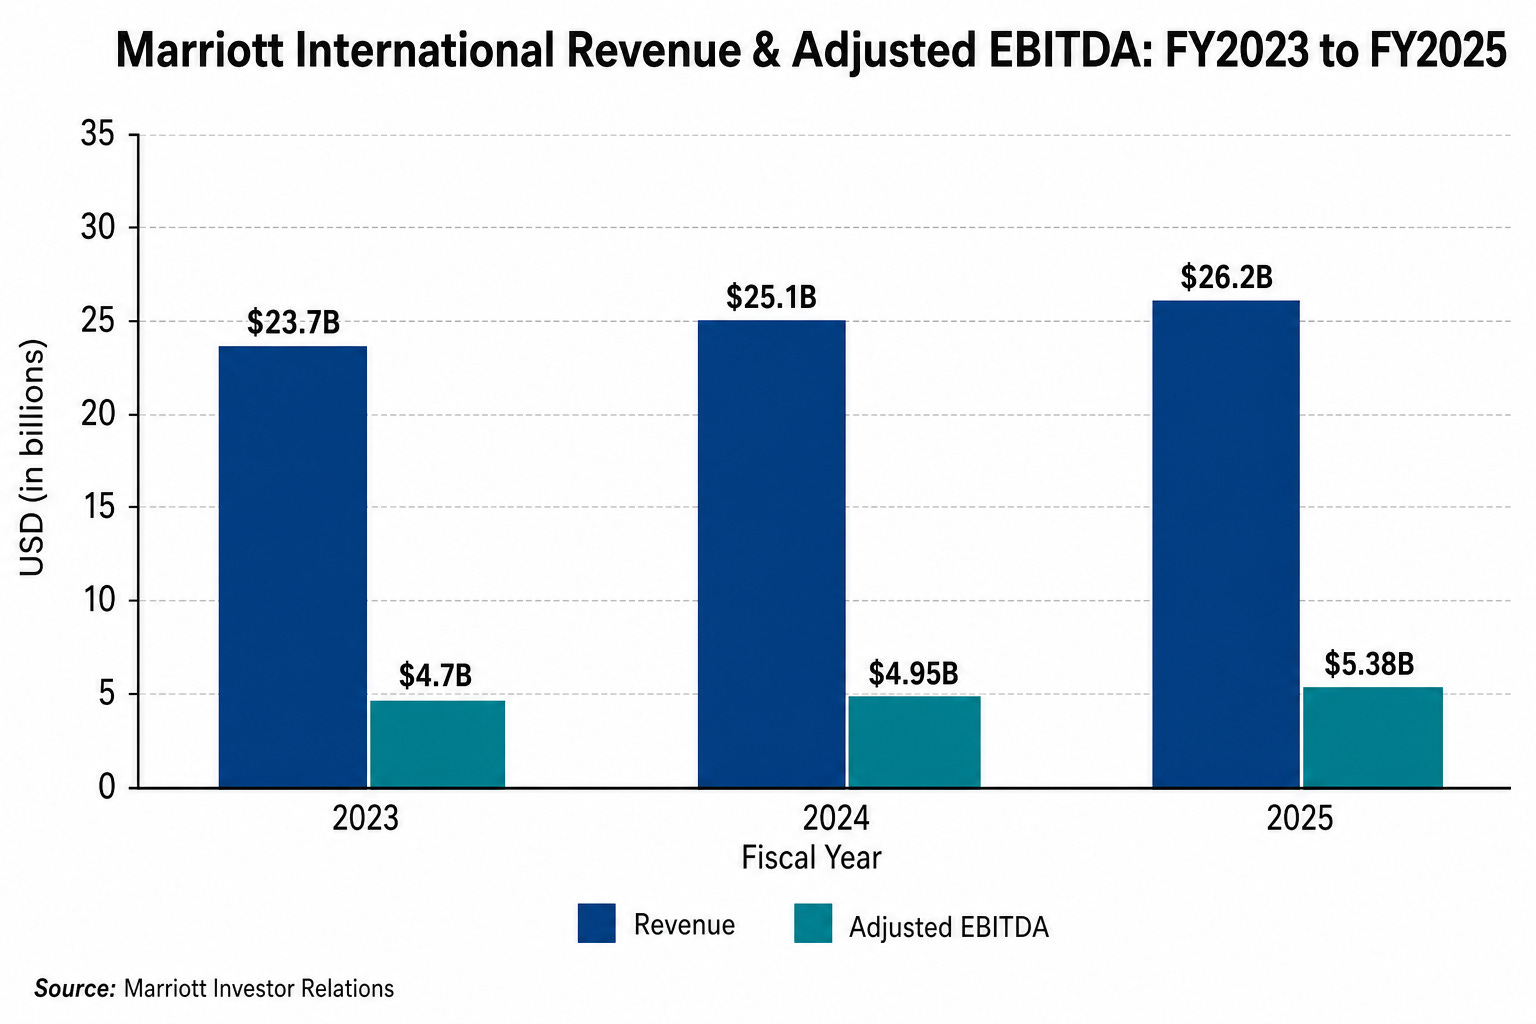
Image source: Deep Research Global analysis, based on Marriott Investor Relations 2023-2025 results.
The Fee Engine Inside the Top Line
The figure that matters far more than total revenue is gross fee revenue. Total gross fee revenues climbed 12% year over year to roughly $1.43 billion in Q1 2026, with a 37% jump in co-branded credit card fees inside that mix.
This is the part of the income statement that drives valuation. Fee revenue is high margin, recurring, lightly capital-consuming, and grows with both RevPAR and unit count.
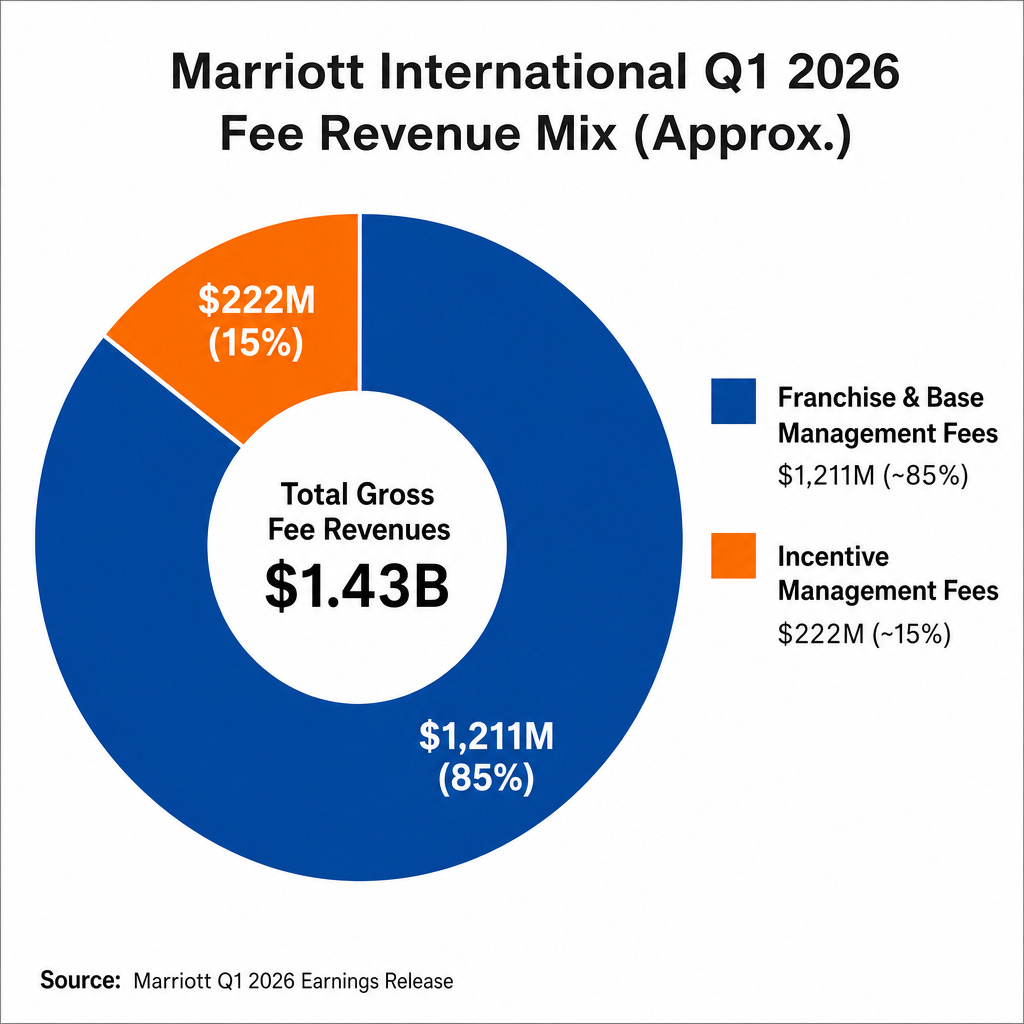
Image source: Deep Research Global analysis, based on Marriott Q1 2026 earnings release.
RevPAR Growth and Regional Mix
Worldwide RevPAR rose 4.2% in Q1 2026, with U.S. and Canada at 4.0% and international markets at 4.6%. APEC excluding China led international performance at over 7% RevPAR growth, with Greater China up almost 6% and EMEA up over 3%.
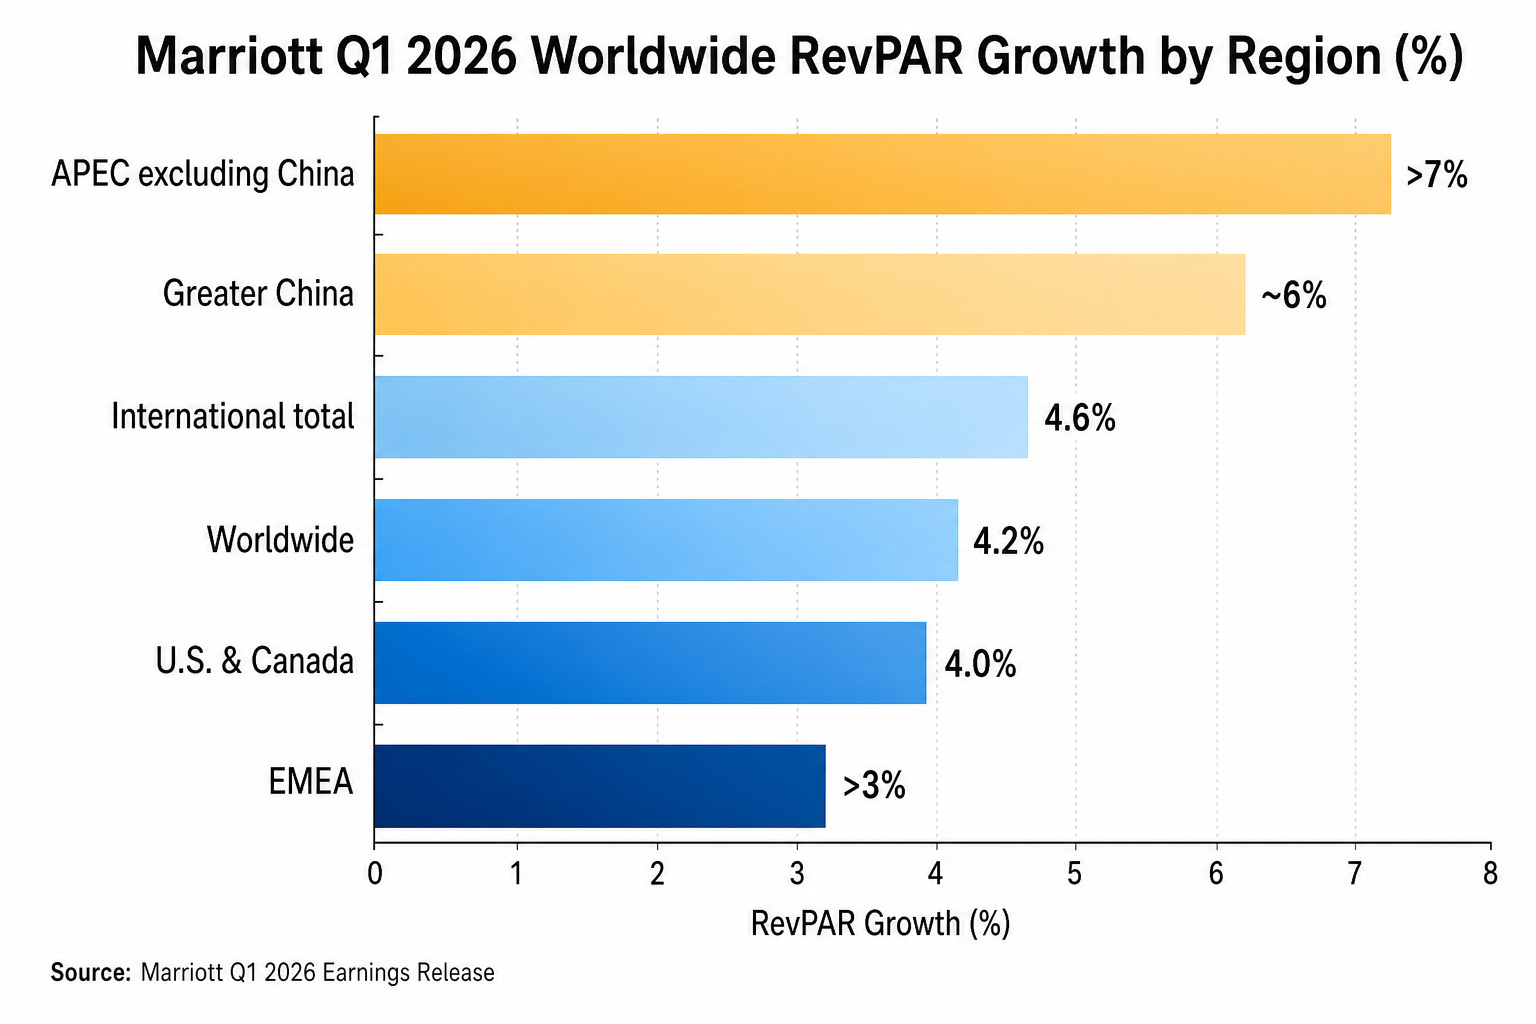
Image source: Deep Research Global analysis, based on Marriott Q1 2026 earnings release.
Q1 2026 REVPAR BREAKDOWN
-----------------------------------------
Worldwide               : +4.2%
U.S. & Canada           : +4.0%
International           : +4.6%
APEC excl. China        : > +7%
Greater China           : ~+6%
EMEA                    : > +3%
Co-Branded Credit Card and Other Non-RevPAR Fees
The single most underappreciated driver of Marriott’s fee growth is co-branded credit cards. Fees from these programs grew 37% year over year in Q1 2026 and were called out by management as a major driver of franchise fee growth.
These fees do not depend on