
Netflix (NFLX) - Fundamental Analysis Report 2026 (Updated)

Dear Readers, Welcome to Deep Research Global.
Let’s analyze the topic in detail.
Executive TL;DR
Netflix (NFLX) closed 2025 with $45.2 billion in revenue (+16% YoY), 325 million paid memberships, and a 29.5% operating margin, then printed a $12.25 billion Q1 2026 with EPS of $1.23.
Management has reiterated full-year 2026 guidance of $50.7B to $51.7B in revenue, a 31.5% operating margin, and roughly $12.5 billion in free cash flow.
The advertising business is on track to roughly double to $3 billion in 2026, with the ad-supported plan now reaching 250 million monthly viewers.
A planned acquisition of Warner Bros. Discovery was terminated in February 2026, with Netflix collecting a $2.8 billion termination fee from Paramount; the company subsequently authorized a new $25 billion buyback and resumed repurchases.
Recommended - Read Full Reports

Read All Reports
Table of Contents
Executive TL;DR
Introduction
Netflix Company Profile: Key Facts
Netflix Investment Thesis
The Core Thesis in Short
Why the Bulls Are Energized in 2026
Why the Bears Push Back
Netflix Business Model Overview
A Subscription-First, Now Multi-Stream Model
The Operating Philosophy
Why Netflix Is Hard to Disrupt
Netflix Revenue Analysis
Top-Line Performance: From $29.7B to a $51B Run Rate
Regional Revenue Mix
Quarterly Revenue Cadence
Netflix Latest Quarterly Earnings: Q1 2026 in Focus
The Headline Print
Free Cash Flow Mechanics
Q2 2026 Guidance and Forward View
Netflix Margins, Earnings Quality, and EPS Trajectory
The Operating Margin Story
Where Margin Comes From
Earnings Quality
EPS Trajectory
Netflix Cash Flow Mechanics
Why Free Cash Flow Matters Most
Capital Allocation Priorities
Content Cash vs. Amortization
Netflix Balance Sheet Health
Liquidity and Debt Profile
Content Obligations and Off-Balance-Sheet Items
Liquidity Posture
Netflix Segment-by-Segment Teardown
Subscriptions: Still the Engine
Advertising: The 2026 Inflection
Live Programming: Sports, Wrestling, and Events
Mobile and Cloud Games
Consumer Products and Experiences
Netflix Strategic and Competitive Context
The Competitive Landscape in 2026
The Warner Bros. Discovery Episode
YouTube as the Real Long-Term Rival
Live Sports and the New Rights Inflation
Netflix Valuation Framework
Where Netflix Trades Today
Multiples-Based View
The DCF Lens
Peer Comparison Considerations
Netflix Bull, Base, and Bear Case Scenario Analysis
Bull Case: The Margin Story Compounds
Base Case: Guidance Delivers
Bear Case: Content Costs Bite Back
Netflix Key Risks for Investors
Content Hit Volatility
Competitive Engagement Pressure
Regulatory and Tax Exposure
Currency Headwinds
Pricing Fatigue
Labor and Production Cost Inflation
Netflix Catalysts to Watch in 2026 and Beyond
Near-Term Quarterly Catalysts
Content Catalysts
Strategic Catalysts
Netflix Engagement and Content Strategy
Engagement Data Reveals Strategy
Why Engagement Quality Matters More Than Hours
Original vs. Licensed Mix
Netflix Advertising Deep Dive
Scale and Trajectory
Ad Tech Buildout
The Ad Inventory Goldmine: Live
Netflix Capital Allocation and Shareholder Returns
The Buyback Story
Dividend Policy
Stock Split Mechanics
Netflix Management and Governance
The Co-CEO Structure
Compensation Philosophy
Board Composition
Netflix International Strategy
Growth Markets
Localization at Scale
Regional Production Hubs
Netflix Technology and AI Strategy
Personalization Engine
Generative AI Integration
Streaming Infrastructure
Netflix Stock Price Context
Recent Trading Range Observations
Volatility Characteristics
Netflix ESG and Sustainability
Environmental
Social
Governance
My Final Thoughts
Collection of Latest Analyst Price Targets
Official Sources and Data
Disclaimer: This analysis is for informational & educational purposes only and should not be construed as investment advice. Investors should conduct their own due diligence and consult with their personal financial advisors before making investment decisions. Past performance does not guarantee future results.
Introduction
Netflix has spent the last 18 months silencing skeptics who thought streaming maturity meant decelerating growth.
Instead, the platform finished 2025 with 16% top-line growth, crossed 325 million paid memberships, and added an ad business that now touches a quarter-billion monthly viewers.
This in-depth analysis report looks into not just what is loud, but what is structural: the 10-for-1 stock split executed in November 2025, the failed Warner Bros. Discovery bid that handed shareholders $2.8 billion in cash, the live-sports push, management’s first explicit $50B+ revenue target, and more.
For investors, the key question right now is whether the rerating since 2022 is finished or just entering its second act.
Netflix Company Profile: Key Facts
Netflix, Inc. is the world’s leading subscription streaming entertainment service, operating in more than 190 countries with a library spanning original series, films, documentaries, mobile games, and an expanding slate of live programming.
The company was founded in 1997 in Scotts Valley, California, by Reed Hastings and Marc Randolph, and is headquartered in Los Gatos, California. It trades on Nasdaq under the ticker NFLX and is a component of the S&P 500 and the Nasdaq-100.
COMPANY SNAPSHOT - NETFLIX, INC. (NFLX)

Founded               : 1997 (Scotts Valley, California)
Headquarters          : 100 Winchester Circle, Los Gatos, CA, USA
CEOs                  : Ted Sarandos & Greg Peters (co-CEOs)
Founder / Chairman    : Reed Hastings (Executive Chairman)
CFO                   : Spencer Neumann
Listing               : NASDAQ: NFLX (S&P 500, Nasdaq-100)
Stock Split           : 10-for-1, effective November 17, 2025
2025 Revenue          : $45.18 billion
2025 Operating Income : $13.33 billion
2025 Operating Margin : 29.5%
2025 Net Income       : $10.98 billion
2025 Diluted EPS      : $2.53
2025 Free Cash Flow   : $9.46 billion
Paid Memberships      : 325M+ at end of Q4 2025
Countries Served      : 190+
Employees             : ~14,000
The shareholder base is dominated by institutional holders, with Vanguard, BlackRock, and Capital Group typically among the top owners according to disclosures filed with the SEC.
After the November 2025 stock split, the share count became materially larger while per-share price compressed to roughly the low triple digits.
The product surface is tightly integrated: a subscription tier ladder (ad-supported, standard, premium), a growing advertising platform, a games portfolio inside the Netflix app, and a live programming layer carrying WWE Raw on Mondays and a recurring slate of NFL games.
Netflix Investment Thesis
The Core Thesis in Short
Netflix has graduated from “growth at any cost” streaming pioneer to a maturing, cash-generative global entertainment platform with three independent monetization engines (subscriptions, advertising, live programming) layered on top of one of the most defensible content libraries in media.
The 2026 setup is unusual because all three engines are accelerating at the same time, even as content amortization growth is held to roughly 10%, creating powerful operating leverage.
The investment debate is no longer “will Netflix survive” but “how big can the model get and at what valuation multiple.”
Why the Bulls Are Energized in 2026
The bull case rests on a margin and free cash flow story that has finally caught up to the revenue story. The company is guiding to a 31.5% operating margin and approximately $12.5 billion in free cash flow for the full year 2026, both records.
NETFLIX BULL THESIS SUMMARY (2026)

1. Revenue growth re-accelerating: +16% in 2025, ~14% midpoint 2026
2. Operating margin expanding: 26.7% (2024) → 29.5% (2025) → 31.5% (2026E)
3. Ad business inflecting: $3B run-rate, 2x YoY, 250M monthly viewers
4. Live programming optionality: NFL (5 games in 2026), WWE Raw, BTS
5. Capital return: $25B new buyback authorization (Apr 2026)
6. Engagement quality at all-time high (per Q1 2026 letter)
What the data shows is a flywheel: more original content drives engagement, engagement supports both subscription pricing power and ad inventory monetization, and the margin uplift funds more content and buybacks.
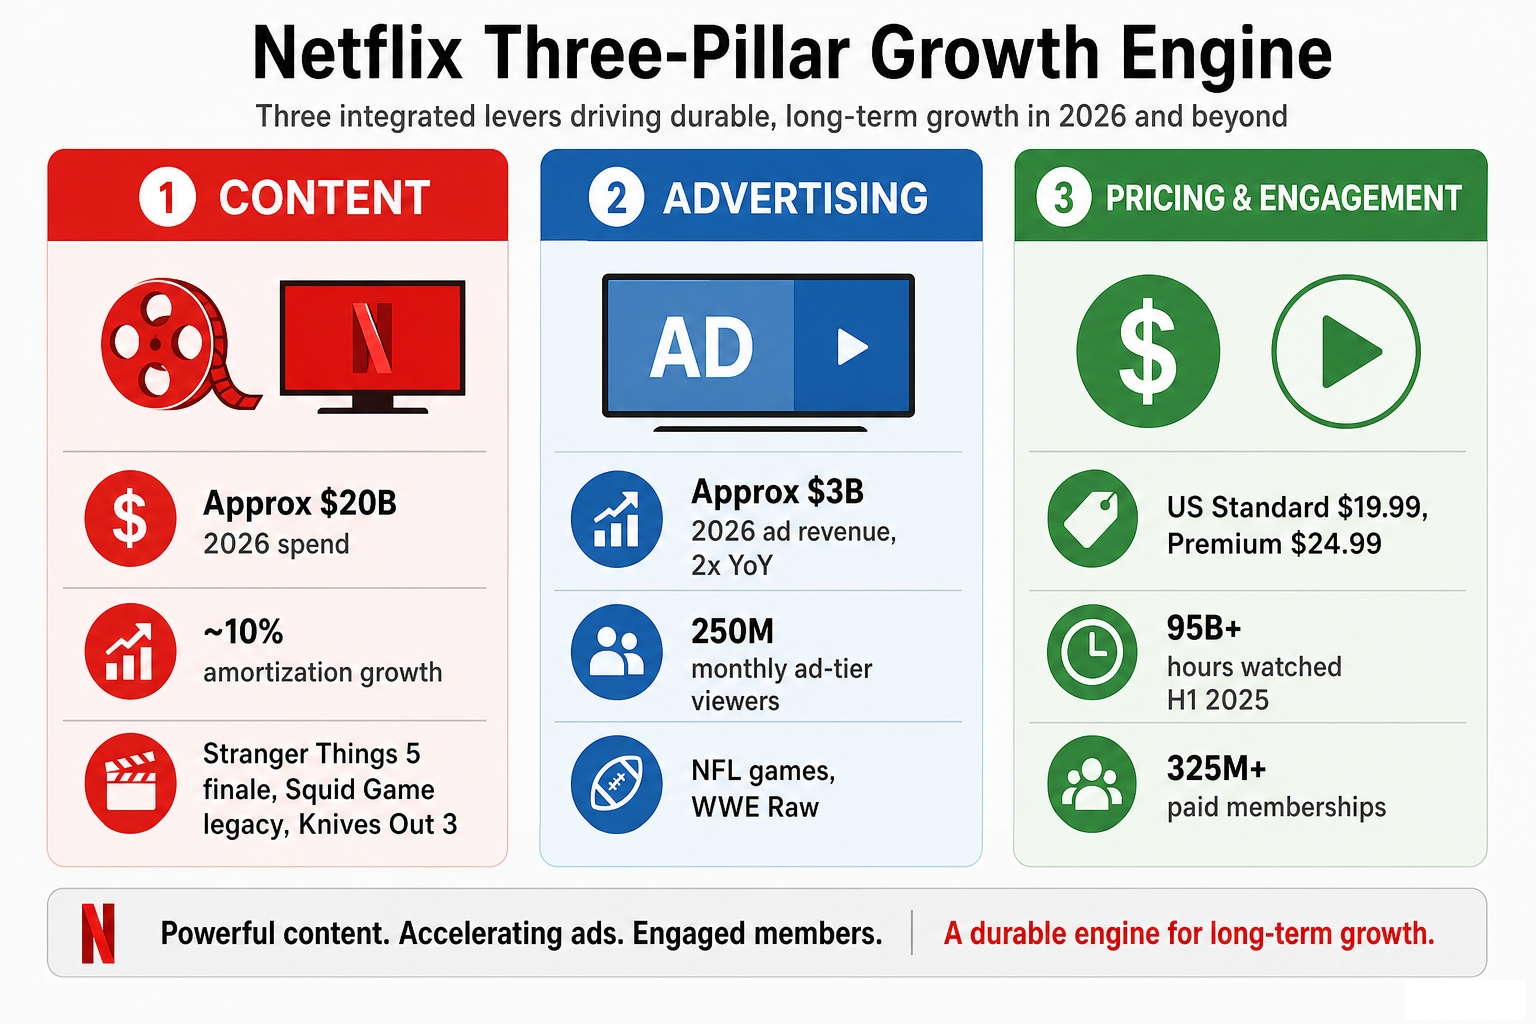
Image source: Deep Research Global analysis, based on Netflix Q1 2026 shareholder letter
Why the Bears Push Back
The bear case is less about Netflix’s quality and more about expectations. The stock currently trades on premium multiples that already discount continued margin expansion. Any deceleration in subscriber growth, an unexpected step up in content amortization, or a tax surprise like the $619 million Brazilian charge booked in Q3 2025 can dent investor confidence quickly.
There is also a structural overhang from the pause in share buybacks earlier in 2026 while management accumulated liquidity for the (ultimately failed) Warner Bros. Discovery bid. That episode reminded investors that Netflix may not always be a pure capital-return story.
Engagement competition from YouTube, short form vertical video, and free ad-supported tiers like Tubi continues to be the slow burn risk that bulls dismiss and bears emphasize.
Netflix Business Model Overview
A Subscription-First, Now Multi-Stream Model
At its core, Netflix sells access to a constantly refreshed library of streaming entertainment for a monthly fee.
Around that core, it has built additional revenue layers including advertising on the ad-supported plan, an extra-member fee for shared accounts, mobile games included in the subscription, and emerging revenue from live events, sponsorships, and consumer products like the Netflix House experiential venues.
The pricing ladder in the United States, following the March 2026 increase, is structured as follows:
NETFLIX U.S. PRICING TIERS (as of March 2026)

Plan                       Monthly Price (USD)
-----------------------------------------------
Standard with Ads          $8.99   (up from $7.99)
Standard (no ads)          $19.99  (up from $17.99)
Premium (4K, 4 streams)    $24.99  (up from $22.99)
Extra Member (Standard)    $8.99
Extra Member (Premium)     $9.99

Source: Netflix help center and CNBC reporting (Mar 26, 2026)
The ad-supported plan has become the on-ramp for the next 200 million members, while the standard and premium plans are increasingly priced as premium SVOD experiences.
The Operating Philosophy
Netflix’s leadership remains unusually disciplined on two metrics: revenue growth and operating margin. The Q1 2026 shareholder letter is explicit that the company evaluates itself on “revenue for growth and operating margin for profitability.”
Beyond those two anchors, free cash flow is the third “guardrail” because content investment timing can pull cash forward in ways that make GAAP profitability misleading.
The company targets a content cash spend to amortization ratio of approximately 1.1x in 2026, meaning cash content investment marginally exceeds the P&L amortization charge.
NETFLIX CORE OPERATING METRICS HIERARCHY

Tier 1 (External):   Revenue growth, operating margin
Tier 2 (Internal):   Engagement quality, retention, ARM
Tier 3 (Capital):    Free cash flow, leverage, share count
Tier 4 (Watchdogs):  Content amortization, marketing intensity
This metric clarity matters for investors because it tells you what management will optimize for in any given quarter. If revenue and margin are tracking, expect content reinvestment to follow.
Why Netflix Is Hard to Disrupt
The platform benefits from three reinforcing moats.
First is a global content production engine refined over more than a decade of original commissioning, with hubs in Los Angeles, London, Seoul, Mumbai, Madrid, and elsewhere.
Second is a recommendation and personalization stack built on enormous viewing data sets.
Third is a payments and pricing infrastructure that lets Netflix run sophisticated multi-currency, multi-tier monetization at scale.
Newer entrants can match one or two of these pieces, but matching all three at Netflix’s scale requires either a generation of investment or a transformative acquisition.
Netflix Revenue Analysis
Top-Line Performance: From $29.7B to a $51B Run Rate
Revenue grew from $29.7 billion in 2021 to $45.2 billion in 2025, a 52% cumulative increase in four years. The 2026 midpoint guide of $51.2 billion implies another 14% growth year.
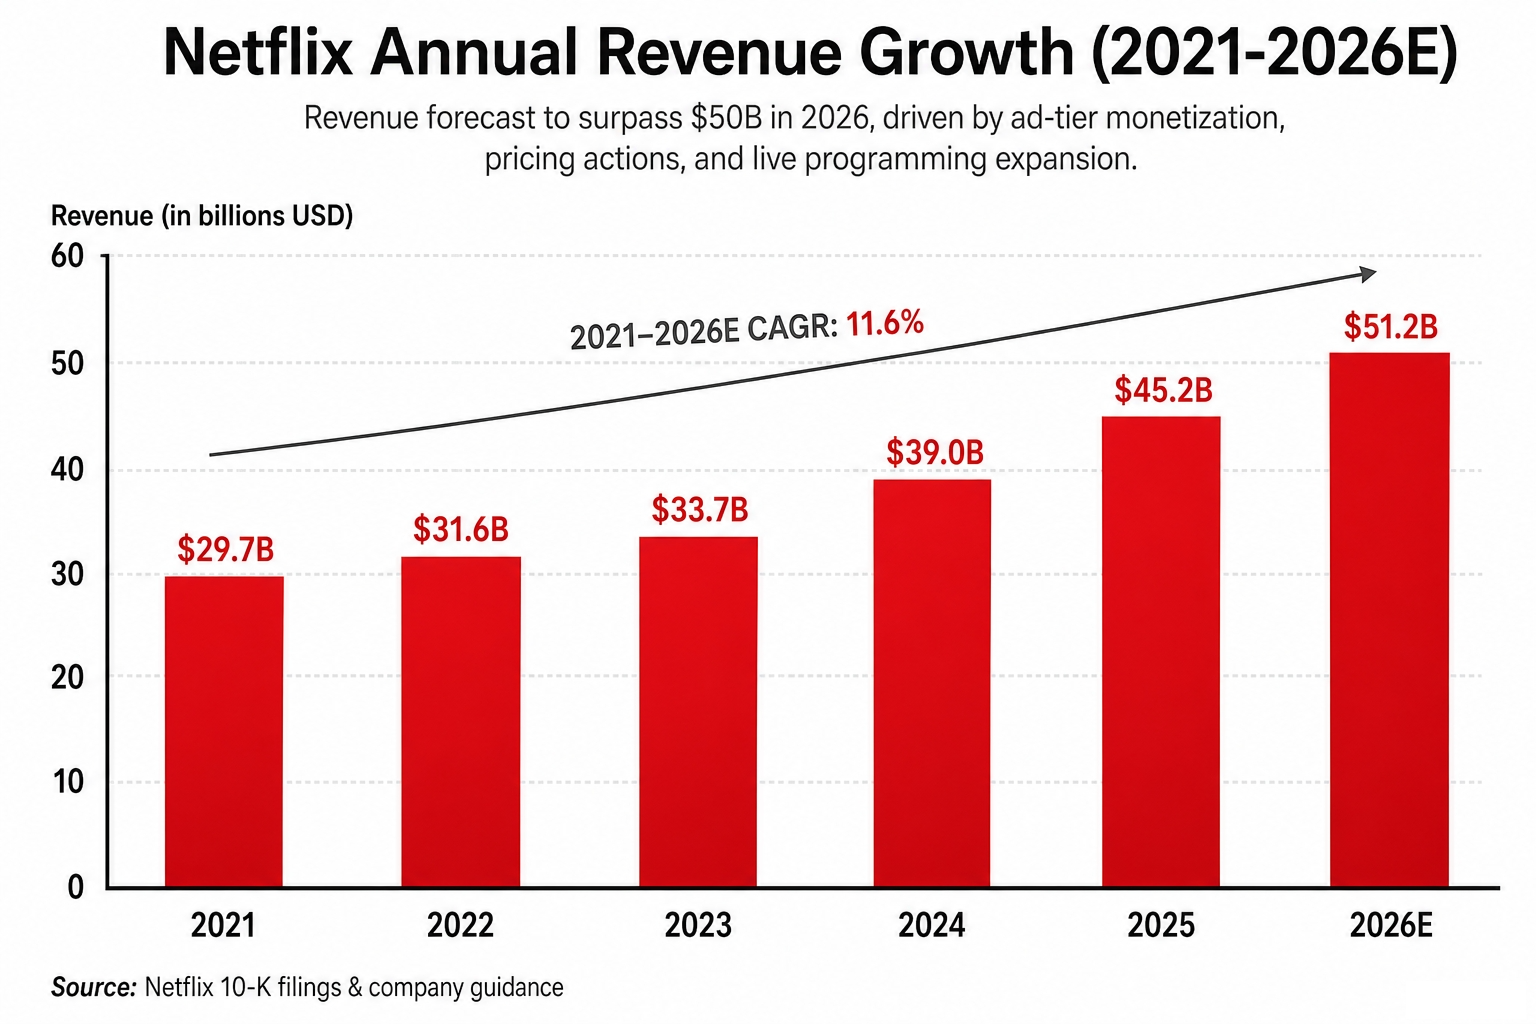
Image source: Deep Research Global analysis based on Netflix annual filings
Three forces are doing the heavy lifting.