
PepsiCo (PEP) - Fundamental Analysis Report 2026 (Updated)

Dear Readers, Welcome to Deep Research Global.
Let’s analyze the topic in detail.
Executive TL;DR
PepsiCo (PEP) delivered $93.9B in FY2025 net revenue with full-year organic revenue growth of 1.7% and core EPS of $8.14, then opened 2026 with stronger momentum (Q1 net revenue +8.5% to $19.4B and core EPS +9%).
The board approved a 4% dividend hike to $5.92 per share, marking the 54th consecutive annual increase, alongside a fresh $10 billion buyback authorization running through February 2030.
A multi-year productivity plan extending to 2030, paired with the merger of Frito-Lay and Quaker into PepsiCo Foods North America (PFNA), is being used to fund affordability investments and accelerate health-forward innovation.
Bolt-on M&A is reshaping the portfolio: the $1.95B purchase of Poppi, the $1.2B Siete Foods deal, and a deeper Celsius/Alani Nu partnership are tilting the company toward better-for-you growth pockets.
Table of Contents
Executive TL;DR
Introduction
PepsiCo Company Profile: Key Facts
The PepsiCo Investment Thesis
Why PEP Even Belongs in a Modern Portfolio
A Reset, Not a Decline
The International Optionality
PepsiCo Business Model Overview
Two Engines: Convenient Foods and Beverages
How the Two Engines Make Money
The Distribution Moat
A Brand-Led, Operations-Heavy Company
PepsiCo Revenue Analysis
The Top-Line Picture
Organic vs Reported Growth
Geographic Mix Is Tilting
Pricing, Volume and Mix
Latest Quarterly Earnings: A Deep Look at Q1 2026
Headline Numbers
Segment-Level Performance
Why The Quality Was High
2026 Guidance Reaffirmed
Margins and Earnings Quality
Gross Margin Dynamics
Operating Margin
Earnings Quality: GAAP vs Core
Earnings Conversion: The 80% Rule
EPS Trajectory and Capital Returns
A Two-Decade Compounding Record
Dividend: The 54-Year Streak
Share Repurchases
Cash Flow Mechanics
A Reliable Cash Machine
Capital Spending Discipline
Working Capital Levers
Balance Sheet Health
Investment-Grade by Design
Liquidity and Cash
Goodwill and Intangibles
Segment-by-Segment Teardown
1) PepsiCo Foods North America (PFNA)
2) PepsiCo Beverages North America (PBNA)
3) International Beverages Franchise (IB Franchise)
4) Europe, Middle East and Africa (EMEA)
5) Latin America Foods
6) Asia Pacific Foods
Strategic and Competitive Context
The Coca-Cola Comparison
Mondelez, Hershey, and the Snacks Battlefield
Energy, Functional, and Better-for-You
Hispanic Foods and the Siete Bet
Distribution Innovation and Joint Ventures
Productivity, Affordability, and the Pep+ Framework
The Multi-Year Productivity Plan
Affordability: A Strategic Reset
Pep+ (PepsiCo Positive)
AI, Digitisation and Operating Leverage
Valuation Framework
What the Multiple Implies
Dividend Yield as a Floor
Free Cash Flow Yield
Sum-of-the-Parts Considerations
Bull, Base and Bear Case Scenario Analysis
Bull Case
Base Case
Bear Case
Key Risks Investors Should Track
Risk 1
Risk 2
Risk 3
Risk 4
Risk 5
Catalysts to Watch
Near-Term (Next 12 Months)
Medium-Term (12 to 36 Months)
Long-Term (3 to 5 Years)
ESG, Sustainability, and Long-Term Positioning
Sustainability as a Cost Variable
Packaging and Plastics
Water and Agriculture
Management Quality and Capital Allocation Discipline
Ramon Laguarta’s Tenure
Capital Allocation Track Record
Bolt-On M&A Discipline
A Note on the Beverage Industry Backdrop
Volume Trends in Carbonated Soft Drinks
Snacks: Still a Growth Category
Functional and Health-Forward Adjacencies
My Final Thoughts
Collection of Latest Analyst Price Targets
Official Sources and Data
Disclaimer: This analysis is for informational & educational purposes only and should not be construed as investment advice. Investors should conduct their own due diligence and consult with their personal financial advisors before making investment decisions. Past performance does not guarantee future results.
Introduction
PepsiCo entered 2026 with a paradox investors do not usually associate with a 60-plus-year dividend grower.
The North American snacks engine that funded so many years of compounding had stalled, yet international beverages and foods were quietly compounding at high-single-digit rates, and Q1 2026 revenue jumped 8.5% to $19.4 billion.
That mix shift, combined with a freshly resized portfolio after Poppi and Siete, and a productivity plan stretching through 2030, makes PEP one of the more interesting Dow-style staples to dissect right now.
This in-depth analysis report walk through the model, segment by segment, so you can decide whether the current setup justifies the multiple.
PepsiCo Company Profile: Key Facts
PepsiCo is a Purchase, New York-based global beverage and convenient food company. Its products are consumed more than one billion times a day across more than 200 countries and territories.
The company’s portfolio spans 23 brands generating more than $1 billion each in estimated annual retail sales, anchored by Pepsi, Lay’s, Doritos, Cheetos, Gatorade, Mountain Dew, Quaker, Tropicana, Aquafina, and Mountain Dew, among others.
- Ticker / Exchange:           PEP / NASDAQ
- HQ:                          Purchase, New York
- CEO:                         Ramon Laguarta (since 2018)
- FY2025 Net Revenue:          $93.925 billion
- FY2025 Core EPS:             $8.14
- FY2025 Free Cash Flow:       ~$8.2 billion
- Dividend (2026, annualized): $5.92 per share
- Consecutive annual hikes:    54
- Reporting segments:          6 (PFNA, PBNA, IB Franchise, EMEA, LatAm Foods, APAC Foods)
- Billion-dollar brands:       23
- Products sold per day: 1+ billion servings in 200+ marketsPepsiCo is the second-largest food and beverage business in the world by net revenue (note: contextual reference only, not used as a primary data source).
Day-to-day operations are led by Chairman and CEO Ramon Laguarta, whose three-pillar growth strategy emphasises portfolio transformation, international expansion, and capturing new consumption occasions.
The PepsiCo Investment Thesis
Why PEP Even Belongs in a Modern Portfolio
The classic case for PepsiCo is simple. The company sells inexpensive, repeat-purchase items into the largest food and beverage distribution network in the West, then compounds price, mix, and productivity on top of that base year after year.
What changed in 2025 and 2026 is the way that base is being managed. Management is now openly prioritising volume recovery, affordability, and health-forward innovation over headline price increases.
The Q1 2026 call made this very clear, with the CEO crediting a holistic commercial strategy built around value-pack adjustments, shelf resets that were roughly 50% complete, and an innovation pipeline now representing about 40% of the portfolio in selected categories.
A Reset, Not a Decline
A key piece of the bull thesis is that PFNA’s 2025 organic revenue decline of 2% is best understood as a reset rather than a structural decline. The merger of Frito-Lay and Quaker into one unified PepsiCo Foods North Americabusiness was meant to simplify the operating model and unlock cross-channel investment.
By Q1 2026, PFNA was already back to 2% organic volume growth and net revenue +2% to $6.33 billion, suggesting the affordability and pack-size moves have started to land.
That single data point matters more than any analyst model, because PFNA had become the variant that scared the long-only crowd. Stabilisation alone moves the company back toward its long-term algorithm of mid-single-digit organic growth plus margin expansion.
The International Optionality
The often-overlooked side of the story is the international business, which generated more than 40% of net revenue and core segment operating profit in 2025, at roughly $38 billion in scale.
In Q1 2026 alone, EMEA delivered +7% organic revenue growth, Asia Pacific Foods +7%, and IB Franchise +5%, while International Beverages booked its 20th consecutive quarter of organic revenue growth.
For an investor used to viewing PepsiCo as a cyclical North American snack story, that international engine is the embedded growth option the market has been slow to re-price.
The Compact PEP Thesis (in three lines)
1. Stabilise the North American snack and beverage core via affordability + innovation
2. Compound the international machine at mid-to-high single digits (currency-adjusted)
3. Convert productivity savings into reinvestment + buybacks + dividend growth
PepsiCo Business Model Overview
Two Engines: Convenient Foods and Beverages
The PepsiCo business model rests on two complementary engines: convenient foods (mostly through Frito-Lay-branded distribution) and beverages (through a hybrid mix of company-owned bottling and franchised bottlers).
Snacks are typically higher margin and benefit from PepsiCo’s industry-leading direct-store-delivery (DSD) infrastructure, which sends route salespeople directly into supermarkets and convenience stores to manage shelves.
Beverages are a more capital-intensive, lower-margin volume business but provide enormous brand visibility, foodservice penetration, and a global reach that snacks cannot easily match.
How the Two Engines Make Money
Operationally, the company manufactures, markets, distributes, and sells its products either directly, through authorised bottlers and contract manufacturers, or via independent distributors and retailers, as described in the latest 10-K.
In some markets the company also licenses its trademarks to third-party bottlers and licensees, generating royalty and concentrate-sale revenue without taking on the full capex of a bottling operation.
That hybrid structure is one of the reasons PepsiCo can earn double-digit margins despite operating in an inflationary input-cost environment, because the beverage segments are not uniformly capital intensive across geographies.
The Distribution Moat
PepsiCo’s DSD network in the United States alone is one of the largest private fleets of any consumer-goods company. Trucks roll out of regional bins and into thousands of stores per day, replenishing chip racks and cold-vault sections.
That kind of network is extremely difficult to replicate. New entrants such as functional sodas often eventually choose to plug into PepsiCo’s distribution rather than build their own, which is the underlying logic behind the Celsius/Alani Nu strategic agreement.
PepsiCo's Distribution Moat (simplified)
- Direct-Store-Delivery for snacks and select beverages
- Broker/warehouse model for shelf-stable foods (Quaker)
- Bottling JV + franchise + concentrate model for global beverages
- Foodservice channel via QSR, theme parks, stadiums, airlines
- Retailer partnerships with category captaincy in salty snacks
A Brand-Led, Operations-Heavy Company
In simple terms, PepsiCo runs a brand-led operations machine. The brands generate the pricing power, the manufacturing footprint converts low-cost agricultural inputs into branded goods, and the distribution network ensures consistent availability.
That combination is what enables the steady 1% to 2% pricing tailwind embedded in management’s algorithm, even before any volume growth or productivity contribution.
The 2025 to 2030 productivity initiative explicitly intends to accelerate organic revenue growth, deliver record productivity savings, and fund affordability initiatives, reinforcing each pillar of the business model.
PepsiCo Revenue Analysis
The Top-Line Picture
PepsiCo finished 2025 with net revenue of $93.925 billion, up 2.3% on a reported basis and up 1.7% organically.
That headline conceals two very different sub-stories: a North America that has been recalibrating after two years of aggressive price-led growth, and an international franchise that has been printing high-single-digit organic growth quarter after quarter.
The Q1 2026 print of $19.4 billion in net revenue confirmed both stories in one quarter. North America stabilised while every international segment delivered organic growth, and reported revenue jumped 8.5% as foreign exchange and selective M&A boosted the absolute figure.
Organic vs Reported Growth
A common point of confusion for new PEP investors is the gap between reported and organic revenue. Reported revenue includes foreign-exchange translation, acquisitions, divestitures, and structural changes such as the 53rd-week effect.
Organic revenue strips all of those out so that the underlying volume-and-price-mix story is visible. In Q1 2026, the 8.5% reported growth versus 2.6% organic growth gap was driven primarily by the lapping of a 53rd week and net benefits from M&A and FX.
The right way to model PEP is to anchor on organic growth as the operating signal, then layer FX, M&A, and divestiture effects on top to get to a reported figure useful for valuation.
Geographic Mix Is Tilting
In 2025, international operations represented more than 40% of net revenue and segment operating profit, and that mix is continuing to tilt outward.
Approximate Geographic Mix (2025)
- North America (PFNA + PBNA):       ~58-60% of net revenue
- International (IB, EMEA, LatAm,
  APAC Foods):                       ~40-42% of net revenue
- Fastest growing regions:            EMEA, AMESA, Latin America
- Mature, lower-growth segments:      North America food + beverage
That international tilt is structurally important because emerging market consumers are still entering modern retail, growing per-capita beverage consumption, and adopting more packaged snacks.
Pricing, Volume and Mix
PepsiCo’s long-term algorithm has historically broken down into about 4% to 6% organic revenue growth, with roughly half from price and mix and the rest from volume.
The 2023 to 2024 period saw an unusual reliance on price as input-cost inflation forced double-digit price moves, which in turn pressured volumes, particularly in U.S. salty snacks.
The Q1 2026 result is important because PFNA, which had been the worst-affected segment, returned to volume growth even as PepsiCo simultaneously took selective price down on multipacks. That is the textbook sign of demand elasticity normalising.
Latest Quarterly Earnings: A Deep Look at Q1 2026
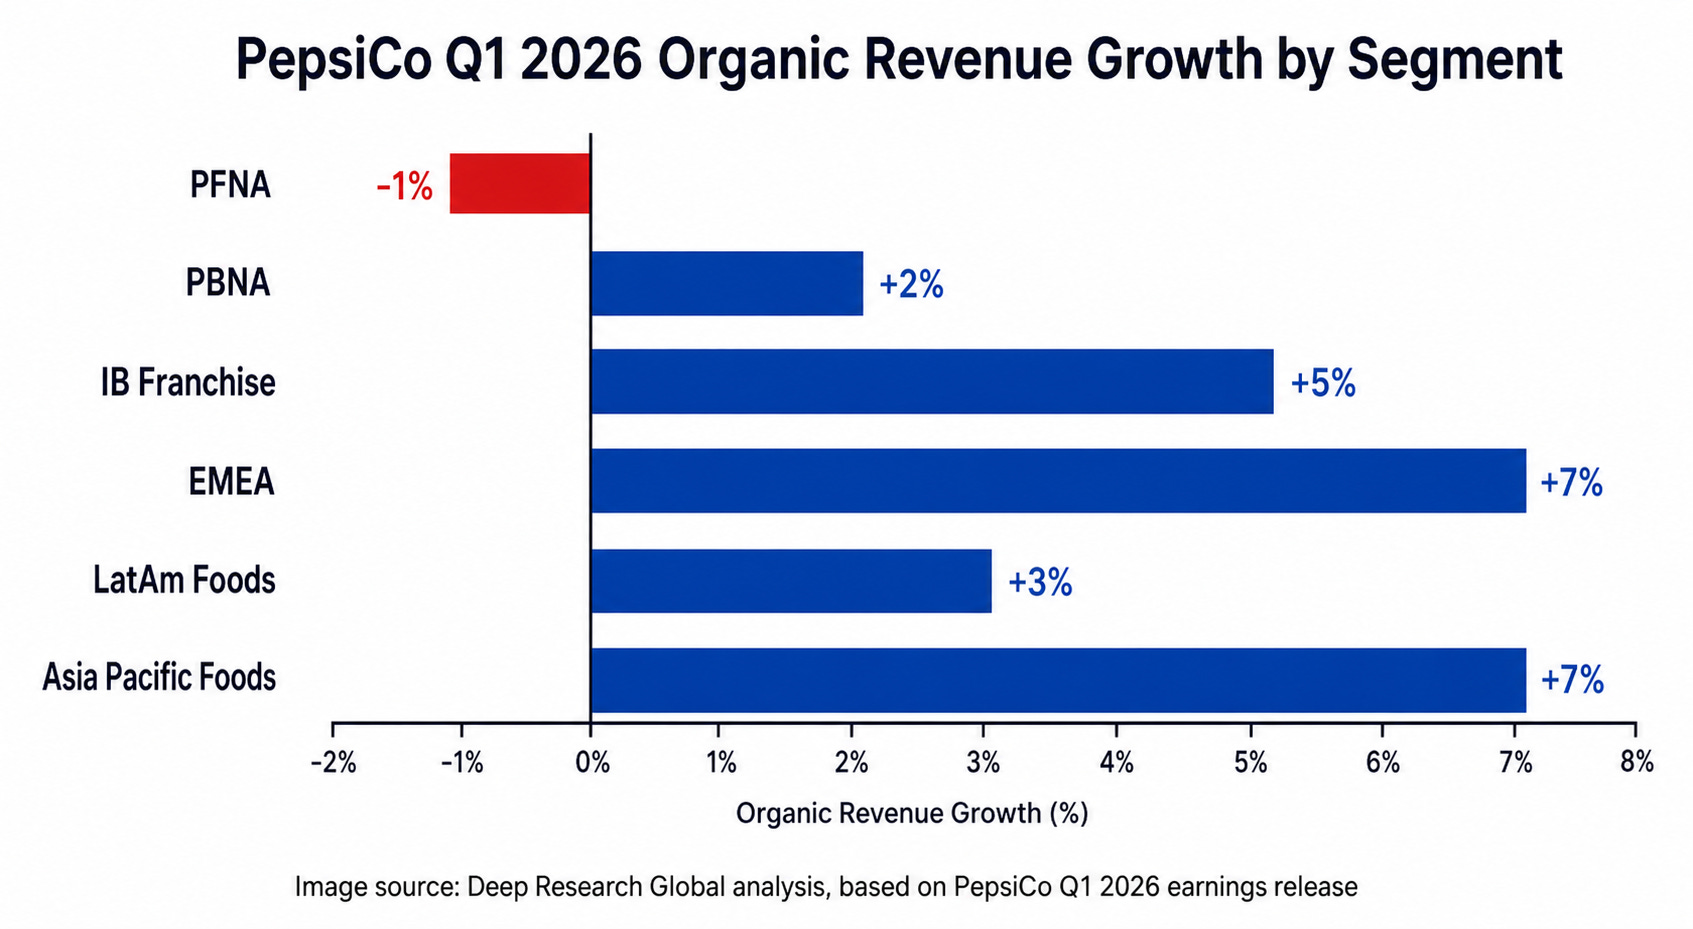
Image source: Deep Research Global analysis, based on PepsiCo Q1 2026 earnings release
Headline Numbers
The Q1 2026 release showed net revenue of $19,443 million, up 8.5%, with organic revenue growth of 2.6%. Operating profit climbed 24% to $3,213 million, and operating margin expanded 210 basis points to 16.5%.
Core operating profit rose 9% to $3,050 million, with core operating margin expanding 10 basis points to 15.7%. EPS reached $1.70 on a GAAP basis, up 27%, while core EPS rose 9% to $1.61 and core constant-currency EPS rose 5%.
That kind of three-way beat (revenue, margin, EPS) was the cleanest single-quarter set of results PepsiCo had delivered in roughly two years.
Segment-Level Performance
Every reporting segment delivered organic revenue growth in Q1, although the magnitudes varied considerably:
Q1 2026 Organic Revenue Growth (verbatim, PepsiCo)
- PepsiCo Foods North America (PFNA):     -1%
- PepsiCo Beverages North America (PBNA): +2%
- International Beverages Franchise:      +5%
- Europe, Middle East and Africa (EMEA):  +7%
- Latin America Foods:                    +3%
- Asia Pacific Foods:                     +7%
The core constant-currency operating profit changes told an even more striking story. PFNA was down 5%, but every other segment posted positive profit growth, with EMEA up 17%, IB Franchise up 14%, and Asia Pacific Foods up 30%.
Why The Quality Was High
The reason I describe the quarter as high quality is