
Red Bull - Fundamental Analysis Report 2026 (Updated)

Dear Readers, Welcome to Deep Research Global.
Let’s analyze the topic in detail.
Executive TL;DR
Red Bull GmbH posted record net sales of €12.196 billion in fiscal 2025, with global can volumes hitting 13.969 billion units, up 10.2% year over year.
The Austrian conglomerate is privately held, debt-free, and outsources virtually all production to partners like Rauch and Ball Corporation, producing a famously asset-light financial model.
Ownership shifted in 2025 so that the Yoovidhya family is no longer majority shareholder of the operating company; the equity now sits with Chalerm Yoovidhya at 51% and Mark Mateschitz at 49%.
Key catalysts and risks include the European Commission antitrust probe opened in November, the Newcastle Falcons rugby acquisition, the Christian Horner dismissal at Red Bull Racing, and the 2026 launch of the Red Bull Ford Powertrains F1 engine.
Table of Contents
Executive TL;DR
Introduction
Red Bull GmbH Company Profile: Key Facts
Red Bull Investment Thesis
A Category-Defining Brand With Pricing Power
An Asset-Light Cash Flow Machine
Sports and Media As Brand Moat
Red Bull Business Model Overview
The Core Product Logic
The Outsourced Manufacturing Backbone
The Media and Sports Layer
A Privately Held, Founder-Controlled Capital Allocator
Red Bull Revenue Analysis
Headline Revenue: 2025 Reset
Volume vs Price Dynamics
Geographic Mix and Regional Growth
Latest Earnings, Guidance, and Margins
Reported 2025 Financial Highlights
Implied Margin Profile
Earnings Quality Considerations
EPS Trajectory
Cash Flow Mechanics
Working Capital Profile
Capital Expenditure Discipline
Dividend Policy and Distribution
Balance Sheet Health
Zero Financial Debt
Liquidity and Cash Reserves
Asset Mix
Red Bull Segment-by-Segment Teardown
Segment 1: Beverages (Energy Drinks and Adjacent)
Segment 2: Formula 1 and Motorsport
Segment 3: Football and Other Owned Sports Teams
Segment 4: Media, Esports, Music, and Apparel
Segment 5: Charity and Soft-Power Operations
Strategic and Competitive Context
The Big Three Globally
U.S. Market Share Dynamics
Health, Sugar-Free, and Functional Trends
Pricing and Channel Dynamics
Regulatory Pressure: The EU Antitrust Probe
Valuation Framework
Implied Enterprise Value Anchors
Trading Multiples From Listed Peers
Brand Value as a Floor
Implications for Listed Peers
Bull, Base, and Bear Case Scenario Analysis
Bull Case
Base Case
Bear Case
Key Risks for Red Bull
Risk 1
Risk 2
Risk 3
Risk 4
Risk 5
Risk 6
Risk 7
Catalysts to Watch
2026 F1 Engine Performance
EU Antitrust Case Milestones
Newcastle Red Bulls Performance
New Manufacturing Capacity
Flavor and Format Innovation
Potential IPO Speculation
My Final Thoughts
Collection of Latest Analyst Views
Official Sources and Data
Disclaimer: This analysis is for informational & educational purposes only and should not be construed as investment advice. Investors should conduct their own due diligence and consult with their personal financial advisors before making investment decisions. Past performance does not guarantee future results.
Introduction
Red Bull is not a publicly traded equity, yet for any serious investor it is impossible to ignore.
The Austrian group is the single largest beverage brand by value in its category, with 2025 revenue near €12.2 billion and an operating profit that the company itself describes as an all-time high.
The company sits at the center of a multi-decade case study on how branding, distribution, and IP-light manufacturing can compound into one of the world’s most valuable consumer franchises.
This report unpacks the fundamentals behind that machine in 2026: how Red Bull actually makes money, where its margins come from, what the segment economics look like outside the can, and what the Christian Horner exit, the Newcastle Falcons buy, and the European Commission probe mean for the next leg of the story.
Red Bull GmbH Company Profile: Key Facts
Red Bull GmbH was founded in 1984 by Austrian entrepreneur Dietrich Mateschitz and Thai partner Chaleo Yoovidhya. Reformulated from the Thai tonic Krating Daeng, the product launched in Austria on April 1, 1987, creating what we now call the “energy drink” category.
The headquarters sits in Fuschl am See, Salzburg, and the company is privately held with no public equity float. By the end of 2025 Red Bull employed 21,924 people and sold its products in 178 countries.
RED BULL GMBH - KEY FACTS SNAPSHOT (FY2025)
-------------------------------------------
Legal entity:        Red Bull GmbH (private, GmbH form)
Headquarters:        Fuschl am See, Salzburg, Austria
Founded:             1984 (product launch April 1, 1987)
Employees (2025):    21,924 (vs 19,973 at YE 2024)
Countries served:    178
Cans sold (2025):    13.969 billion (+10.2% YoY)
Group turnover:      EUR 12.196 billion (+8.6% YoY)
Capital structure:   No financial debt; equity-only
Ownership:           Chalerm Yoovidhya 51% / Mark Mateschitz 49%
Manufacturing:       Outsourced (Rauch + Ball Corporation)
The capital structure is unusual for a consumer goods business of this scale. Red Bull carries no financial debt and finances its growth and investments from operating cash flow.
Investment Thesis
For investors who cannot directly buy Red Bull stock, the brand still matters.
It anchors the global energy drink category, sets the pricing umbrella that listed competitors like Monster and Celsius operate under, and influences distribution dynamics inside every beverage portfolio that competes in the segment.
A Category-Defining Brand With Pricing Power
Red Bull invented the energy drink category in Western markets. That first-mover position has translated into Austria’s most valuable brand, with brand value rising 11% to €8.7 billion in 2025 per Brand Finance.
Pricing power follows from that brand position. Red Bull’s per-can pricing in convenience and grocery has consistently set the premium tier benchmark in energy drinks across most developed markets.
The thesis is not that Red Bull will out-innovate Celsius on functional ingredients or beat Monster on flavored extensions.
It’s that its core 250 ml SKU continues to act like a global standard, and that the brand’s marketing engine fills the demand funnel almost without traditional advertising spend.
An Asset-Light Cash Flow Machine
Red Bull does not own factories. Production is outsourced to Rauch Fruchtsäfte and to Ball Corporation, which handles canning. The recent joint factory in North Carolina is another step in this co-located, partner-operated supply model.
This structure means Red Bull’s balance sheet is dominated by working capital, brand assets, and minority sports investments, not by depreciating plant and equipment.
Because the model converts revenue to cash with very little reinvestment in heavy assets, founders’ heir Mark Mateschitz reportedly received a €648 million dividend for fiscal 2025 from his 49% stake.
Sports and Media As Brand Moat
The sports portfolio is not a side business. It is the brand’s distribution channel for cultural relevance.
Red Bull Racing in Formula 1, RB Leipzig and Red Bull Salzburg in football, the New York Red Bulls in MLS, EHC Red Bull München in ice hockey, Red Bull Bragantino in Brazil, and now the Newcastle Red Bulls in English rugby all serve the same function.
The sponsorship spend exceeded €1 billion paid to athletes for the first time in 2022, and that intensity has continued.
For investors in competing public companies, this is the structural disadvantage. Monster and Celsius can outspend Red Bull on specific markets or specific occasions, but they cannot replicate the cultural ownership of action sports, F1, and electronic music that Red Bull has compounded over 30 years.

Red Bull Business Model Overview
Red Bull’s business model has been remarkably stable across four decades, but it is more sophisticated than the often-quoted “marketing company that sells caffeine” line.
The Core Product Logic
The flagship 250 ml can launched in Austria in 1987. It contains caffeine, taurine, B-group vitamins, sugars (or sweeteners in sugar-free variants), and the now-iconic positioning around “wiiings”. The recipe and positioning have been kept extraordinarily consistent.
That consistency is itself a strategic decision. While Coca-Cola and PepsiCo iterate constantly across their portfolios, Red Bull treats its hero SKU like a luxury good with predictable taste, packaging, and price points.
The flavored Editions exist as extensions, but management has historically resisted cannibalization of the core. The 2026 product cycle includes a Cherry Sakura Spring Edition and a returning Fuji Apple and Ginger winter flavor.
The Outsourced Manufacturing Backbone
Rauch Fruchtsäfte produces and bottles. Ball Corporation supplies the aluminium can. The two companies operate integrated facilities alongside Red Bull’s own logistics network.
The newly groundbreaking $1.7 billion North Carolina campus is the second integrated U.S. manufacturing facility built specifically for this trio. The setup is so deeply intertwined that the delayed Concord, NC project finally broke ground in 2025 after four years of pauses.
For investors, this matters because it means most of Red Bull’s manufacturing capital expenditure sits on partners’ balance sheets, not its own.
THE RED BULL VALUE CHAIN (SIMPLIFIED)
-------------------------------------
1. Brand IP & marketing  --> Red Bull GmbH (Austria)
2. Concentrate & recipe  --> Red Bull GmbH (controlled)
3. Production & canning  --> Rauch + Ball Corporation
4. Distribution          --> Mix of Red Bull subsidiaries
                              + 3rd-party distributors
5. On-premise marketing  --> Red Bull GmbH (controlled)
6. Sports & media        --> Red Bull Media House +
                              owned teams + sponsorships
The Media and Sports Layer
Red Bull Media House is the second layer of the model. It runs ServusTV in Austria, the largest private broadcaster in the country, and operates Red Bull TV across multiple streaming platforms.
The Media House produces content from live sports broadcasts to feature documentaries. Its content is then licensed, distributed, and used as long-form marketing for the brand.
The owned-team layer extends this. The Newcastle Red Bulls rugby acquisition, completed in August 2025, is a clean example: Red Bull bought a Premiership rugby franchise outright, rebranded it, and slotted it into the global owned-content portfolio.
A Privately Held, Founder-Controlled Capital Allocator
Capital allocation at Red Bull works the way it would at a family holding company. Decisions are made by the two ownership blocks, not by a public shareholder base.
The 2025 sale of the personal stake formerly held by Chalerm Yoovidhya meant that for the first time in Red Bull GmbH’s history, the Yoovidhya family is no longer the majority shareholder of the operating company. Mark Mateschitz’s 49% stake now equals the Yoovidhya bloc, which has implications for governance and decision speed.
Red Bull Revenue Analysis
The headline number is straightforward, but the composition is worth unpacking.
Headline Revenue: 2025 Reset
Group turnover increased 8.6% in 2025, from €11.227 billion in 2024 to €12.196 billion in 2025. In U.S. dollar terms this works out to roughly $14.3 billion at then-current rates.
The 8.6% growth rate is the strongest revenue print Red Bull has delivered since the post-pandemic surge in 2022. It reflects both volume (10.2% can growth) and a small negative mix and FX effect.
Volume vs Price Dynamics
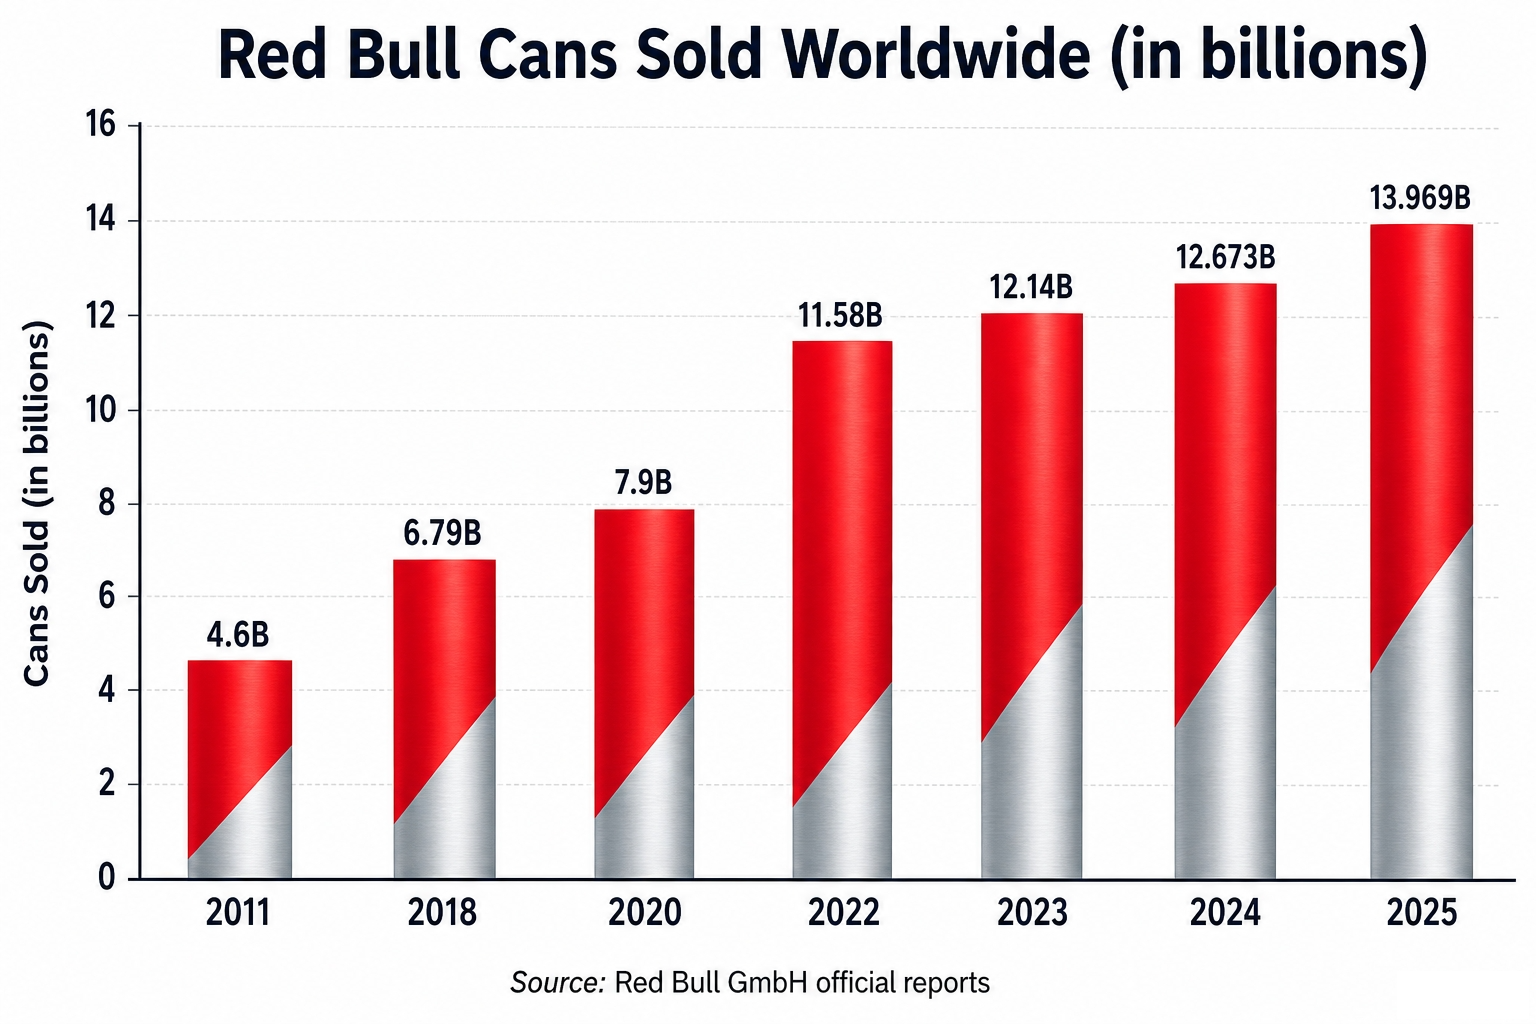
Image source: Deep Research Global analysis, based on Red Bull GmbH official company reports and historical disclosures.
The 13.969 billion cans sold in 2025 means the average net revenue per can globally was