
SK Hynix (000660.KS) - Fundamental Analysis Report 2026 (Updated)

Dear Readers, Welcome to Deep Research Global.
Let’s analyze the topic in detail.
Executive TL;DR
SK hynix booked record Q1 2026 revenue of KRW 52.58 trillion with a 72% operating margin and a 198% YoY revenue jump, lifted by HBM, server DRAM and enterprise SSD demand.
The company has sold out 2026 output across DRAM, HBM and NAND, with HBM4 sampling to Nvidia and 16-layer 48GB stacks already shown publicly.
Net cash flipped from negative into a KRW 35 trillion net cash position at the end of Q1 2026, giving the firm rare balance-sheet flexibility for the Yongin and Cheongju build-outs.
Korean brokerages now anchor 12-month price targets between KRW 2.7 million and KRW 3 million, citing a forward P/E still in the mid-single digits.
Recommended - Read Full Reports


Read All Reports
Table of Contents
Executive TL;DR
Introduction
SK hynix Company Profile: Key Facts Snapshot
SK hynix Investment Thesis
The structural bull case
Why this cycle is structurally different
A second-derivative thesis
The supply-side moat
Why this isn’t 2017 redux
SK hynix Business Model Overview
Revenue mechanics: how the money flows
Four revenue engines
The Solidigm leverage point
Why the model is hard to replicate
SK hynix Revenue Analysis
Annual revenue trajectory
Quarterly trajectory into 1Q 2026
Pricing vs. volume decomposition
The 2026 outlook from the company’s own mouth
Latest Quarterly Earnings, Guidance & Margins
The 1Q 2026 print in detail
Why margins jumped this far
Q2 2026 expectations
Earnings quality
EPS trajectory
Cash flow mechanics
Balance sheet health
SK hynix Segment-by-Segment Teardown
Segment 1: HBM (high-bandwidth memory)
HBM3E generation
HBM4 generation
HBM4E and beyond
Segment 2: Server DRAM (DDR5, MRDIMM, high-capacity modules)
Segment 3: Mobile DRAM (LPDDR5X, LPDDR6)
Segment 4: NAND flash and enterprise SSD
Segment 5: Solidigm and adjacent capabilities
Major SK hynix Competitors
SK hynix vs. Samsung Electronics
Where Samsung leads
Where SK hynix leads
Net competitive read
SK hynix vs. Micron Technology
Where Micron leads
Where SK hynix leads
Net competitive read
SK hynix vs. Chinese memory entrants
SK hynix Strategic Context
Capacity strategy: the M15X bridge
Capacity strategy: Cheongju advanced packaging
Capacity strategy: Yongin Semiconductor Cluster
Capex discipline
Customer concentration: Nvidia and OpenAI
Government and geopolitical posture
The CEO vision: Full Stack AI Memory Creator
SK hynix Valuation Framework
Why standard memory multiples are inadequate
Multiple approaches
Korean broker consensus context
The net cash adjustment
Mid-cycle versus peak earnings debate
Bull, Base and Bear Case Scenario Analysis
Bull case
Base case
Bear case
Probability-weighted thinking
Key Risks for SK hynix
Risk 1
Risk 2
Risk 3
Risk 4
Risk 5
Risk 6
Risk 7
Risk 8
Catalysts to Watch
Near-term catalysts (next 6 months)
Medium-term catalysts (6 to 18 months)
Long-term catalysts (18 months and beyond)
Macro and policy catalysts
My Final Thoughts
Latest Analyst Price Targets
Official Sources & Data
Disclaimer: This analysis is for informational & educational purposes only and should not be construed as investment advice. Investors should conduct their own due diligence and consult with their personal financial advisors before making investment decisions. Past performance does not guarantee future results.
Introduction
If you only learn one thing about AI memory in 2026, learn this: the single supplier that sits between Nvidia’s Vera Rubin roadmap and the world’s hyperscaler data-center build cycle is no longer just a quiet Korean memory house.
SK hynix has just printed the most profitable quarter in its history at a 72% operating margin, and management has already locked in customer demand through the end of next year.
This report unpacks what that means for investors.
We will walk through the HBM lead, the balance-sheet transformation, the Solidigm-amplified NAND franchise, and the Yongin mega-cluster, then stress-test the story against Samsung, Micron, and a credible bear case.
The numbers are unusual; the questions they raise are even more so.
SK hynix Company Profile: Key Facts Snapshot
Company:              SK hynix Inc.
Ticker:               000660.KS (Korea Exchange)
GDR listing:          Luxembourg Stock Exchange
Headquarters:         2091, Gyeongchung-daero, Bubal-eup, Icheon-si, Korea
CEO (President):      Kwak Noh-Jung
Parent group:         SK Group (SK Square is the largest shareholder)
Core products:        DRAM (incl. HBM), NAND flash, eSSD, mobile DRAM
Major subsidiaries:   Solidigm (enterprise SSD), SK hynix system ic
Reporting standard:   K-IFRS, consolidated
FY2025 revenue:       KRW 97.1 trillion (record)
FY2025 op. profit:    KRW 47.2 trillion (record)
1Q26 revenue:         KRW 52.58 trillion
1Q26 op. margin:      72%
Net cash (1Q26 end):  ~KRW 35 trillion
The company is the world’s top-tier semiconductor supplier of DRAM and NAND flash and the dominant supplier of high-bandwidth memory to Nvidia. Its fab footprint stretches across Icheon and Cheongju in Korea, with the Yongin Semiconductor Cluster now ramping construction.
SK hynix operates through a vertically aligned model where memory design, wafer fabrication, advanced packaging, and (via Solidigm) enterprise SSD assembly sit under one corporate umbrella.
The structure is unusual among pure-play memory peers and gives the company end-to-end control over the HBM stack-and-package process.
The capital structure is anchored by SK Square as the largest shareholder, with the National Pension Service of Korea historically a major holder. The company pays a fixed annual dividend and trades within the KOSPI 200, where it has become one of the two heaviest weights alongside Samsung Electronics.
The cultural pivot under Kwak Noh-Jung from “memory maker” to Full Stack AI Memory Creator frames the entire 2031 product roadmap: custom HBM, SOCAMM modules, AI-tuned NAND, and processing-in-memory primitives.
SK hynix Investment Thesis
The structural bull case
The company sits at the chokepoint of generative-AI hardware spend, with HBM volumes that customers cannot yet replace from any other supplier in the same generation window.
Margins have re-rated from cyclical commodity averages into specialty-component territory because HBM ASPs are negotiated bilaterally rather than spot-cleared.
And the balance sheet now funds growth out of operating cash flow rather than debt.
Why this cycle is structurally different
Past memory cycles ended when supply additions caught up and ASPs collapsed.
This time, wafer capacity additions take four to five years and the global shortfall could exceed 20% according to SK Group chairman Chey Tae-won.
The bottleneck is no longer fab construction speed; it is HBM packaging throughput, EUV tool delivery, and advanced silicon interposer supply.
Adding to the rigidity, HBM consumes roughly three times the wafer area of comparable conventional DDR5 per gigabit, which means every additional HBM unit shipped permanently subtracts from commodity DRAM supply.
The cross-elasticity now runs in SK hynix’s favor in both segments.
Conventional cycle (2017 - 2023):
  ↑ ASPs → ↑ Capex → ↑ Capacity → ↓ ASPs (12-24 month cycle)

Current AI cycle (2024+):
  ↑ HBM demand → wafer absorption into HBM → ↓ commodity supply
→ ↑ commodity ASPs → ↑ blended marginsA second-derivative thesis: agentic AI
Most current HBM demand is tied to model training, but management’s commentary on the 1Q26 call argued that agentic AI’s real-time inference workloads create a second leg of demand.
Inference is far more memory-bound than compute-bound for large reasoning models, so each new wave of deployed agents adds incremental HBM and high-capacity server DRAM consumption.
That dynamic is what changes the demand curve from “training fleet refresh” to “always-on per-user memory utilization.”
The shape is closer to a utility load curve than a one-time hardware upgrade.
The supply-side moat
SK hynix’s edge in HBM rests on a multi-layer process advantage rather than a single patent.
The company commercialized MR-MUF packaging ahead of peers, hit 12-layer HBM4 sample delivery first, and is the only supplier currently inside Nvidia’s Blackwell-class production with multiple-generation continuity.
The customer side adds another moat.
Once a hyperscaler integrates HBM into a board-level design, the qualification cost of switching mid-generation runs into tens of millions of dollars and months of testing.
That makes HBM a stickier, almost ASIC-like component.
Why this isn’t 2017 redux
In 2017 the cycle was driven by smartphone DRAM and a single Nvidia-Crypto wave; supply normalization broke prices within four quarters.
In 2026 the demand base is broader (Nvidia, AMD, Google TPUs, custom hyperscaler silicon, Chinese accelerators), the supply base is narrower (HBM4 ships from effectively three vendors), and contracts have begun to extend toward long-term agreements that lock in volumes for multiple quarters.
SK hynix Business Model Overview
Revenue mechanics: how the money flows
SK hynix earns revenue primarily through wafer-out memory chips sold either as bare DRAM/NAND dies, as packaged modules (DIMMs, SOCAMMs), as stacked HBM cubes, or as finished enterprise SSDs through the Solidigm subsidiary.
Pricing is negotiated quarterly or under multi-quarter contracts with hyperscalers, OEMs, and module makers.
The mix matters enormously to the margin profile.
A single 12-layer HBM4 stack with TSV packaging fetches an ASP many times higher than the underlying commodity DRAM dies that go into it.
As the HBM percentage of total DRAM bits ships rises, blended ASP and margin follow.
Four revenue engines
Engine 1:  HBM (high-bandwidth memory)
           Customers: Nvidia, AMD, Google, Broadcom-class custom silicon
           Pricing:   Bilateral, multi-quarter contracts
           Margin:    Highest in portfolio; specialty-component economics

Engine 2:  High-capacity server DRAM (DDR5, MRDIMM, SOCAMM)
           Customers: Hyperscalers, server OEMs
           Pricing:   Contract pricing, semi-annual; spot exposure low
           Margin:    Premium to mobile DRAM, expanded sharply in 2025-26

Engine 3:  Mobile DRAM (LPDDR5X, LPDDR6)
           Customers: Smartphone OEMs (Apple, Samsung MX, Chinese OEMs)
           Pricing:   Contract pricing with seasonal swings
           Margin:    Mid-tier, benefits from LPDDR6 process ramp

Engine 4:  NAND flash and eSSD (via SK hynix + Solidigm)
           Customers: Hyperscalers (eSSD), PC OEMs, smartphone makers
           Pricing:   Contract for enterprise, spot exposure for client
           Margin:    Historically thinner, but AI-driven QLC demand
materially lifted ASPs through 2025 and 2026The Solidigm leverage point
SK hynix’s 2021 acquisition of Intel’s NAND business, rebranded as Solidigm, gave the group a top-tier enterprise SSD franchise. That deal is now the unsung hero of the 2025-2026 NAND story.
AI training and inference clusters need vast pools of high-capacity QLC enterprise SSDs to feed the GPU complex. Solidigm’s product lineup, paired with SK hynix’s TLC strength, lets the combined entity serve both performance and capacity tiers in a single sales motion.
In the 1Q26 release, the company specifically called out synergies with Solidigm in QLC eSSDs as a strategic priority for AI data-center storage.
Why the model is hard to replicate
Building a competing model would require, simultaneously, a leading HBM process node, a top-three NAND franchise, advanced packaging capacity, and customer trust with Nvidia.
That combination exists in very few places on the planet, and the capital cost of replication runs into the tens of trillions of won over half a decade.
SK hynix Revenue Analysis
Annual revenue trajectory
The company has executed one of the most dramatic top-line expansions in the global semiconductor industry.
From KRW 32.8 trillion in 2023 at the bottom of the down-cycle, revenue scaled to KRW 66.2 trillion in 2024 and KRW 97.1 trillion in FY2025 record results.
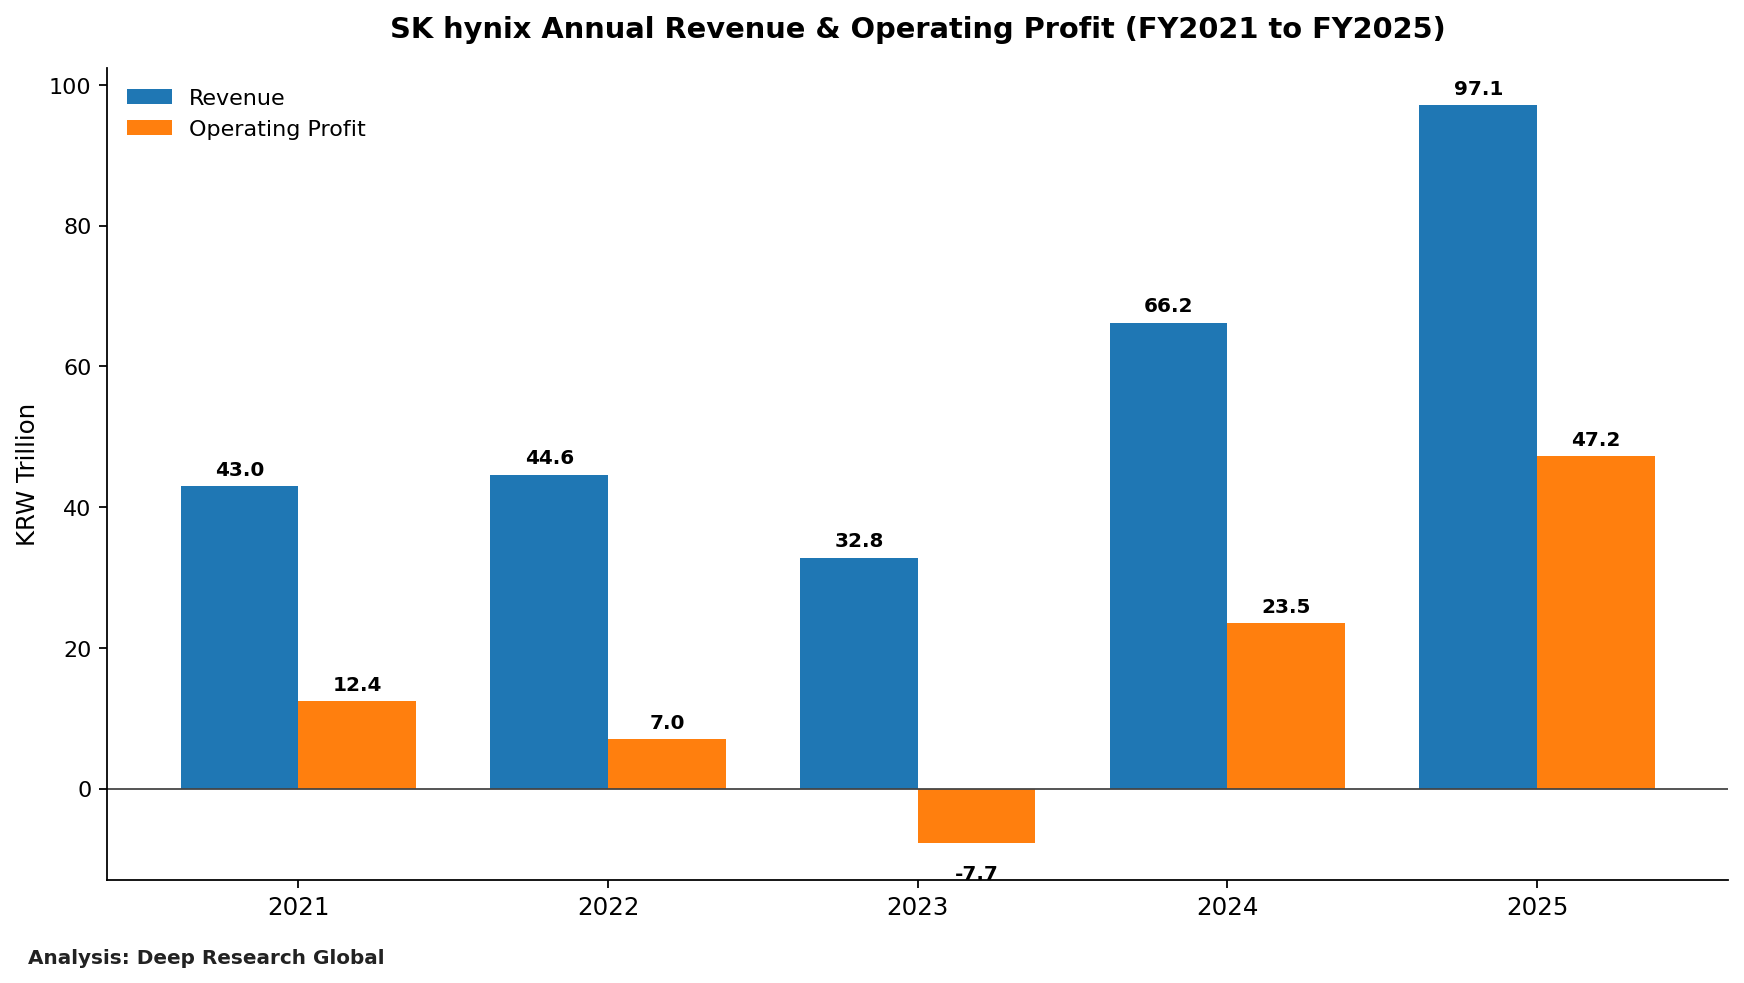
Image source: Deep Research Global analysis. Annual revenue and operating profit for SK hynix from FY2021 through FY2025, plotted in KRW trillions. The chart highlights the V-shaped recovery from the 2023 cyclical trough into back-to-back record years.
SK hynix Annual KPIs (KRW trillion, K-IFRS consolidated):
  FY2021:  Revenue 43.0  |  Operating Profit  12.4
  FY2022:  Revenue 44.6  |  Operating Profit   7.0
  FY2023:  Revenue 32.8  |  Operating Profit  -7.7  (cycle trough)
  FY2024:  Revenue 66.2  |  Operating Profit  23.5
FY2025: Revenue 97.1 | Operating Profit 47.2 (prior record)Quarterly trajectory into 1Q 2026
The quarterly cadence is even more illustrative because it shows the inflection in real time.
The record 1Q26 print of KRW 52.58 trillion in revenue marked the first time the company ever crossed KRW 50 trillion in a single quarter.
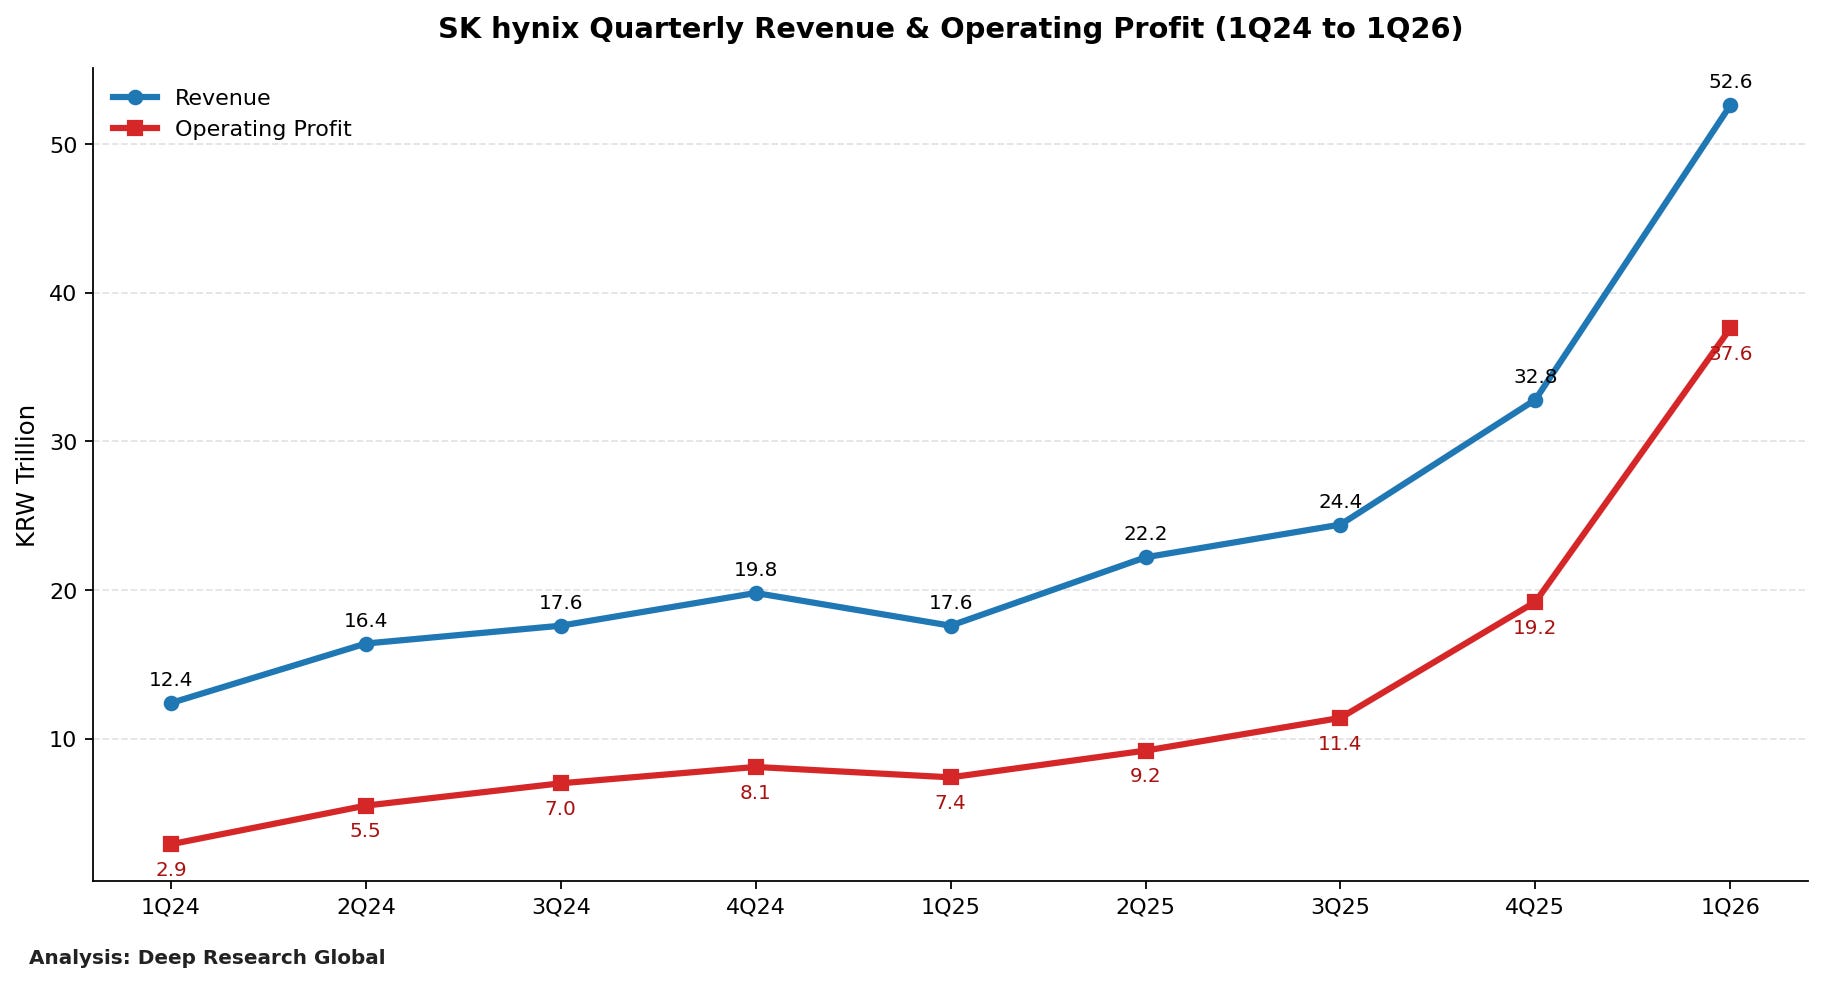
Image source: Deep Research Global analysis. Quarterly revenue and operating profit from 1Q 2024 through 1Q 2026 in KRW trillions, showing the steepening acceleration into the 1Q 2026 record.
Pricing vs. volume decomposition
The headline 198% YoY revenue jump in 1Q26 was driven by