
SpaceX - Fundamental Analysis Report 2026 (Updated)

Dear Readers, Welcome to Deep Research Global.
Let’s analyze the topic in detail.
Executive TL;DR
SpaceX filed its public S-1 prospectus on May 20, 2026, targeting a June 2026 listing at a valuation reportedly in the $1.5 trillion to $2 trillion range, making it the largest IPO in U.S. history.
Reported 2025 revenue of $18.7 billion (up 33% year over year) with Starlink alone contributing $11.39 billion and roughly $4.5 billion in segment operating income.
The company posted a GAAP net loss of $4.9 billion in 2025 while delivering adjusted EBITDA of $6.58 billion, with capex of $20.7 billion in 2025 and another $10.1 billion in Q1 2026 alone.
The bull thesis rests on Starlink V3 capacity, Direct-to-Cell with T-Mobile, Starship V3 maturation, and Starshield national security work; the bear thesis centers on xAI cash burn, dependence on a single CEO, and an aggressive valuation premium to comparable space and connectivity peers.
Recommended - Read Full Reports


Read All Reports
Table of Contents
Executive TL;DR
Introduction
SpaceX Company Profile: Key Facts Snapshot
SpaceX Investment Thesis
Pillar 1
Pillar 2
Pillar 3
Pillar 4
SpaceX Business Model Overview
Segment 1: Space (Launch + Dragon + Lunar)
Segment 2: Connectivity (Starlink + Starshield)
Segment 3: AI (xAI / X)
SpaceX Revenue Analysis
Revenue Composition by Segment
Quarterly Trajectory
Backlog and Forward Bookings
Latest Quarterly Earnings, Guidance, and Margins
Q1 2026 Headlines
Margin Architecture
Earnings Quality
EPS Trajectory
Cash Flow Mechanics and Balance Sheet Health
Operating Cash Flow
Capital Expenditures
Balance Sheet Position
SpaceX Segment-by-Segment Teardown
Space Segment Deep Dive
Falcon 9 and Falcon Heavy
Dragon Spacecraft
Starship and Super Heavy
Connectivity Segment Deep Dive
Starlink Residential
Starlink Business, Maritime, Aviation, Mobile
Starlink Direct-to-Cell (D2C)
Starshield (Government & Defense)
AI Segment Deep Dive
Major SpaceX Competitors
Launch Competitors
Connectivity Competitors
AI Competitors
Head-to-Head: SpaceX vs Rocket Lab
Head-to-Head: SpaceX vs Blue Origin
Head-to-Head: SpaceX vs Amazon Project Kuiper
Head-to-Head: SpaceX vs ULA
SpaceX Strategic Context
Defense Modernization Tailwind
Broadband Universalization
AI Infrastructure Scaling
U.S.-China Space Race
SpaceX Valuation Framework
The Sum-of-the-Parts View
Multiple Compression Risk
Comparable Reference Set
Bull, Base, and Bear Case Scenarios
Bull Case
Base Case
Bear Case
Key Risks for SpaceX
Risk 1
Risk 2
Risk 3
Risk 4
Risk 5
Risk 6
Risk 7
Risk 8
Risk 9
Risk 10
Catalysts to Watch (Next 12 to 24 Months)
Near-Term Catalysts (Next 6 Months)
Medium-Term Catalysts (12 to 24 Months)
SpaceX Adjusted EBITDA by Segment
Industry Backdrop and TAM
Capital Allocation and IPO Use of Proceeds
SpaceX vs The Sector ETFs
Operational Cadence Through Year-End 2026
The Special Question of Insider Selling and Lock-Ups
Governance and Disclosure Considerations
Comparable Mega-Cap IPO Reference Points
Workforce and Talent Density
ESG and Sustainability Considerations
Latest Analyst Price Targets (Pre-IPO)
My Final Thoughts
Official Sources & Data
Disclaimer: This analysis is for informational & educational purposes only and should not be construed as investment advice. Investors should conduct their own due diligence and consult with their personal financial advisors before making investment decisions. Past performance does not guarantee future results.
Introduction
For more than two decades, retail investors could only watch from the bleachers as private capital captured the upside of one of the most consequential industrial companies of our era.
That changes in June 2026.
The S-1 filed with the SEC on May 20, 2026, finally lifts the curtain on a business that produced $18.7 billion in revenue, operates the world’s only reusable orbital-class booster fleet, controls a 10.3 million-subscriber satellite internet service, and is preparing the rocket the U.S. government has selected to return astronauts to the Moon.
This deep dive report walks through the company profile, segment economics, launch cadence trajectory, the Starlink unit economics, the competitive landscape against Rocket Lab, Blue Origin, ULA and Project Kuiper, the bull, base and bear scenarios, and the catalyst calendar through 2027.
If you are evaluating SpaceX as an IPO allocation or weighing exposure through derivatives and proxies, this analysis give you the basis you need before forming your own view.
SpaceX Company Profile: Key Facts Snapshot
Space Exploration Technologies Corp., or SpaceX, was founded in 2002 by Elon Musk with the stated long-term goal of making humanity a multi-planet species. Its headquarters and primary engineering campus sit in Hawthorne, California, with the Starship production and launch facility at Starbase, Texas.
The S-1 confirms three reportable segments: Space (launch services, Dragon spacecraft, government contracts), Connectivity (Starlink consumer, enterprise, mobility, and Starshield national security), and AI (xAI and X Corp following the March 2025 merger).
SPACEX KEY FACTS SNAPSHOT (AS OF Q1 2026)
-----------------------------------------------
Founded:               March 14, 2002
Headquarters:          Hawthorne, California
Starbase site:         Boca Chica, Texas
Employees:             ~ 13,800 globally (S-1)
Founder & CEO:         Elon Musk
President & COO:       Gwynne Shotwell
2025 Revenue:          $18.7 billion
Q1 2026 Revenue:       ~ $5.4 billion
2025 Net Loss (GAAP):  ($4.9) billion
2025 Adj. EBITDA:      $6.58 billion
Starlink subs (Q1'26): 10.3 million paid
Falcon launches 2025:  167 (a global record)
Last Private Round:    $400B (Jul 2025)
Tender Offer Dec 2025: $800B implied
IPO Target Valuation:  $1.5T to $2.0T
The dual-class structure outlined in the prospectus preserves Musk’s control through Class B super-voting shares, an arrangement consistent with other Musk-led entities.
For investors, this means SpaceX will not be subject to a typical activist or proxy contest pathway.
The corporate footprint includes McGregor, Texas (engine test), Cape Canaveral and Kennedy Space Center (East Coast launch), Vandenberg (West Coast launch), Redmond, Washington (Starlink satellite manufacturing), and Bastrop, Texas (Starlink user-terminal production).
The vertical integration across propulsion, vehicles, satellites, terminals, ground systems, and the user app stack is a defining structural feature.
SpaceX Investment Thesis
The headline pitch for SpaceX is not a launch company anymore.
It’s a connectivity utility, a defense prime, and an AI infrastructure operator that happens to own the world’s most cost-competitive transportation system to orbit.
Pillar 1: The Cost Curve Advantage in Launch
The Falcon 9 program has bent the cost curve in orbital lift more than any vehicle in history. The fleet flew 167 times in 2025, capturing roughly 82% of all global commercial launches by count and a meaningfully higher share by upmass.
That cadence is the moat.
Each booster’s life now stretches to over twenty flights, fairings recover routinely, and the second-stage cost has fallen as production scales.
FALCON 9 PROGRAM SCALE INDICATORS
------------------------------------------------
Total Falcon launches to date:        654+
First-stage recoveries:               ~ 95%
Active booster fleet (B5):            ~ 20 units
Most flights by single booster:       29
Theoretical 2026 target:              180+ flights
Internal launch (Starlink):           ~ 75% of cadence
External commercial backlog:          $30B+ (S-1)
That internal-versus-external split is one of the most underappreciated structural points: SpaceX is now its own largest launch customer through Starlink.
The economics of vertical integration effectively put the company’s expensive transportation cost on the inside of the corporate balance sheet, turning it into a margin lever rather than a third-party expense.
Pillar 2: Starlink as a Recurring Connectivity Utility
The S-1 confirms what private-market estimates had only modeled: Starlink is now a software-eaten telecom asset with $11.39 billion in 2025 revenue and a $4.42 billion segment operating profit, equivalent to an adjusted EBITDA margin of about 63%.
That margin profile, if sustainable, would place Starlink in the company of premium global software businesses rather than legacy ISPs that typically clear 30 to 40 percent.
The subscriber math is even more striking.
Paid subscriptions climbed from 2.3 million at year-end 2023 to 4.4 million in 2024, 8.9 million by year-end 2025, and 10.3 million by the close of Q1 2026.
STARLINK SUBSCRIBER TRAJECTORY (PAID SUBS, MILLIONS)
----------------------------------------------------
Dec 2023:    2.3
Dec 2024:    4.4   (+91% YoY)
Dec 2025:    8.9   (+102% YoY)
Mar 2026:    10.3  (+105% YoY vs Q1'25 ~5.0)
Sell-side modeled run-rate by Dec 2026: 18M+
S-1 disclosed enterprise/mobility share rising
Yet the ARPU story is more nuanced.
The blended monthly ARPU has fallen from roughly $99 in 2023 to about $81 in 2025, and SpaceX expects further declines as residential users in lower-income geographies become a larger share of the mix.
Management’s framing is that the unit economics improve regardless because each new Starlink V2 Mini and V3 satellite lowers the cost per delivered gigabit, and operating leverage on the fixed satellite cost base offsets ARPU compression.
Pillar 3: Starshield and National Security
Starshield is the classified-customer arm of the connectivity business, built around proliferated low-earth-orbit constellations sold to U.S. defense and intelligence customers. The publicly known anchor is a $1.8 billion classified contract with the National Reconnaissance Office signed in 2021.
Subsequent additions include $733.5 million in launch awards for the Space Development Agency tranche, multiple NRO follow-ons, and growing work with the U.S. Space Force under the National Security Space Launch contract vehicle.
KEY GOVERNMENT CONTRACT EXPOSURE (PUBLIC)
-------------------------------------------------
NRO classified constellation (2021):    $1.8B
NASA Artemis HLS (Option A + B):        $4.5B
NASA Commercial Crew (life of program): $4.9B+
NASA Cargo Resupply CRS-2:              $3.5B+
NSSL Phase 3 launches:                  $5B+ (multi-year)
SDA tranche launches:                   $733.5M
Starshield additional classified work:  Undisclosed
Investors should view Starshield as a long-duration, recurring, sovereign-customer revenue stream with high switching costs and limited Western competition at scale.
The political resilience of these contracts, even through administrative transitions, is one of the structural underwriting points in the S-1.
Pillar 4: Optionality in Starship, Mars, and AI
Optionality is the part of the thesis that is hardest to underwrite and most aggressively priced.
Starship V3, first flown in May 2026, is designed to deliver 100 to 200 tonnes to low earth orbit with rapid reusability, an order-of-magnitude improvement over Falcon 9.
The Mars program has been formally pushed in priority during 2026 in favor of the Artemis lunar program, but an uncrewed Mars demonstrator remains a 2026 to 2027 stretch goal pending vehicle qualification.
The AI segment, now consolidated from the xAI and X merger, introduces both upside optionality and significant near-term cash drag.
The pillar is real, but in 2026 it is a use of cash, not a contributor of cash.
SpaceX Business Model Overview
The business model is built around three reinforcing engines: own the cheapest transportation to orbit, use that transportation to deploy your own constellation, then monetize the constellation across consumer, enterprise, mobility, government, and direct-to-device channels.
Segment 1: Space (Launch + Dragon + Lunar)
The Space segment produced $4.086 billion in 2025 revenue, an operating loss of $657 million on a GAAP basis, and adjusted EBITDA of $653 million.
External customers include commercial satellite operators, NASA, the Space Force, NRO, international agencies, and private astronaut missions like Polaris Dawn.
SPACE SEGMENT REVENUE COMPOSITION (FY 2025)
-----------------------------------------------
Commercial launch (external):     ~ $1.5B
NASA Commercial Crew & Cargo:     ~ $1.2B
National Security launches:       ~ $1.1B
Other (HLS milestone, services):  ~ $0.3B
Total Space Segment Revenue:        $4.086B
GAAP segment operating result:      ($0.657B)
Adjusted EBITDA:                    $0.653B
The segment is structurally lower-margin than Connectivity because it is project-based, milestone-driven, and bears the bulk of the heavy R&D for Starship and Raptor 3.
Investors should not expect Space-segment margins to expand meaningfully until Starship reaches operational cadence and amortizes its development costs.
Segment 2: Connectivity (Starlink + Starshield)
Connectivity is the cash engine of SpaceX today. Revenue of $11.387 billion in 2025 was 61% of total company revenue, with segment operating income of $4.423 billion and adjusted EBITDA of $7.168 billion.
Q1 2026 acceleration is the standout: Starlink revenue of $3.26 billion implies an annualized run rate north of $13 billion entering the IPO window.
Within Connectivity, the product taxonomy is now meaningfully diversified across residential, Starlink Business, Starlink Maritime, Starlink Aviation, Starlink Mobile (RVs and roaming), and the rapidly expanding Direct-to-Cell service under the T-Mobile T-Satellite partnership.
CONNECTIVITY PRODUCT MIX (S-1 DISCLOSURE)
-----------------------------------------------
Residential Internet:        Majority of subs
Starlink Business / Enterprise:   Higher ARPU tier
Starlink Maritime:           4-figure monthly ARPU
Starlink Aviation:           Multi-year carrier deals
Starlink Mobile / Roam:      Travel & RV use case
Direct to Cell (T-Satellite): Launched commercially July 2025
Starshield (classified):     Government only
The Direct-to-Cell service is the most strategically significant addition because it materially expands the addressable market beyond households with broadband demand to roughly every mobile-phone user on Earth.
The carrier-of-carriers model with T-Mobile in the U.S. and reciprocal partners across multiple continents shifts Starlink from a fixed-broadband alternative to a complementary roaming and emergency-connectivity layer.
Segment 3: AI (xAI / X)
The AI segment, the result of the March 2025 xAI and X consolidation, generated $3.2 billion in 2025 revenue with an operating loss of approximately $6.4 billion as research and development climbed sharply.
Q1 2026 saw revenue rise modestly, but cash burn intensified, with the segment posting losses of around $2.5 billion in the quarter.
AI SEGMENT (xAI / X) KEY METRICS (FY 2025)
-----------------------------------------------
Total Revenue:               $3.2B (+22% YoY)
Operating Loss:               ($6.4B)
R&D Spend:                    $5.0B (+331% YoY)
Anthropic compute deal:       ~ $1.25B / month
Memphis "Colossus" cluster:   100K H100 GPUs+
Grok user base:               Disclosed in S-1
The strategic logic is that owning a foundation model and a social distribution channel (X) creates a flywheel for AI compute demand, advertising, and data.
The investment cost, however, is substantial, and the AI segment is the single largest reason the consolidated GAAP loss remains negative through Q1 2026.
SpaceX Revenue Analysis
The revenue base has moved from launch-dominated to connectivity-dominated in just three years. The 2022 revenue mix was roughly two-thirds Space and one-third Starlink; the 2025 mix is roughly 22% Space, 61% Connectivity, and 17% AI.
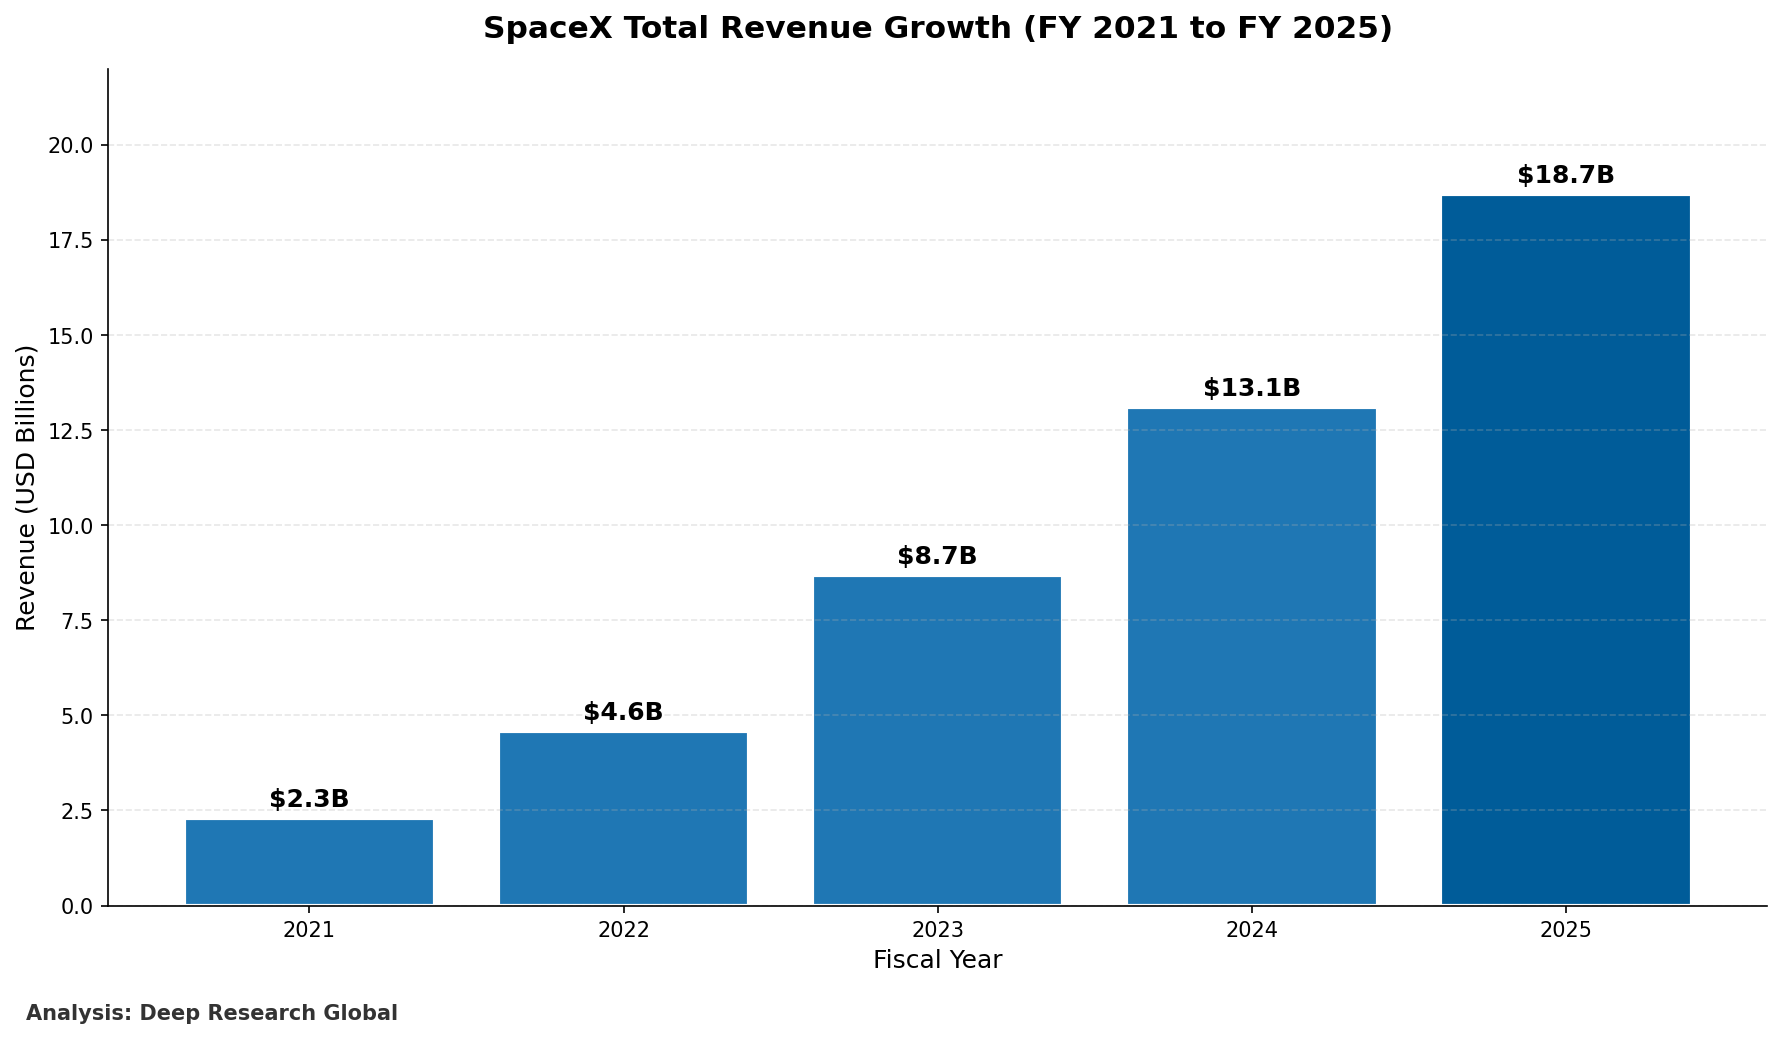
Image source: Deep Research Global analysis, based on SpaceX S-1 prospectus, Sacra estimates, and Morningstar pre-IPO commentary. Chart shows total SpaceX revenue scaling from $2.3B in 2021 to $18.7B in 2025, a roughly 8x growth in four years.
Revenue Composition by Segment
The S-1 disclosure for fiscal 2025 splits the $18.7 billion total cleanly: Connectivity at $11.387B, Space at $4.086B, and AI at $3.2B. Q1 2026 reinforced the trend, with Connectivity contributing the lion’s share of the $5.4 billion quarterly total.
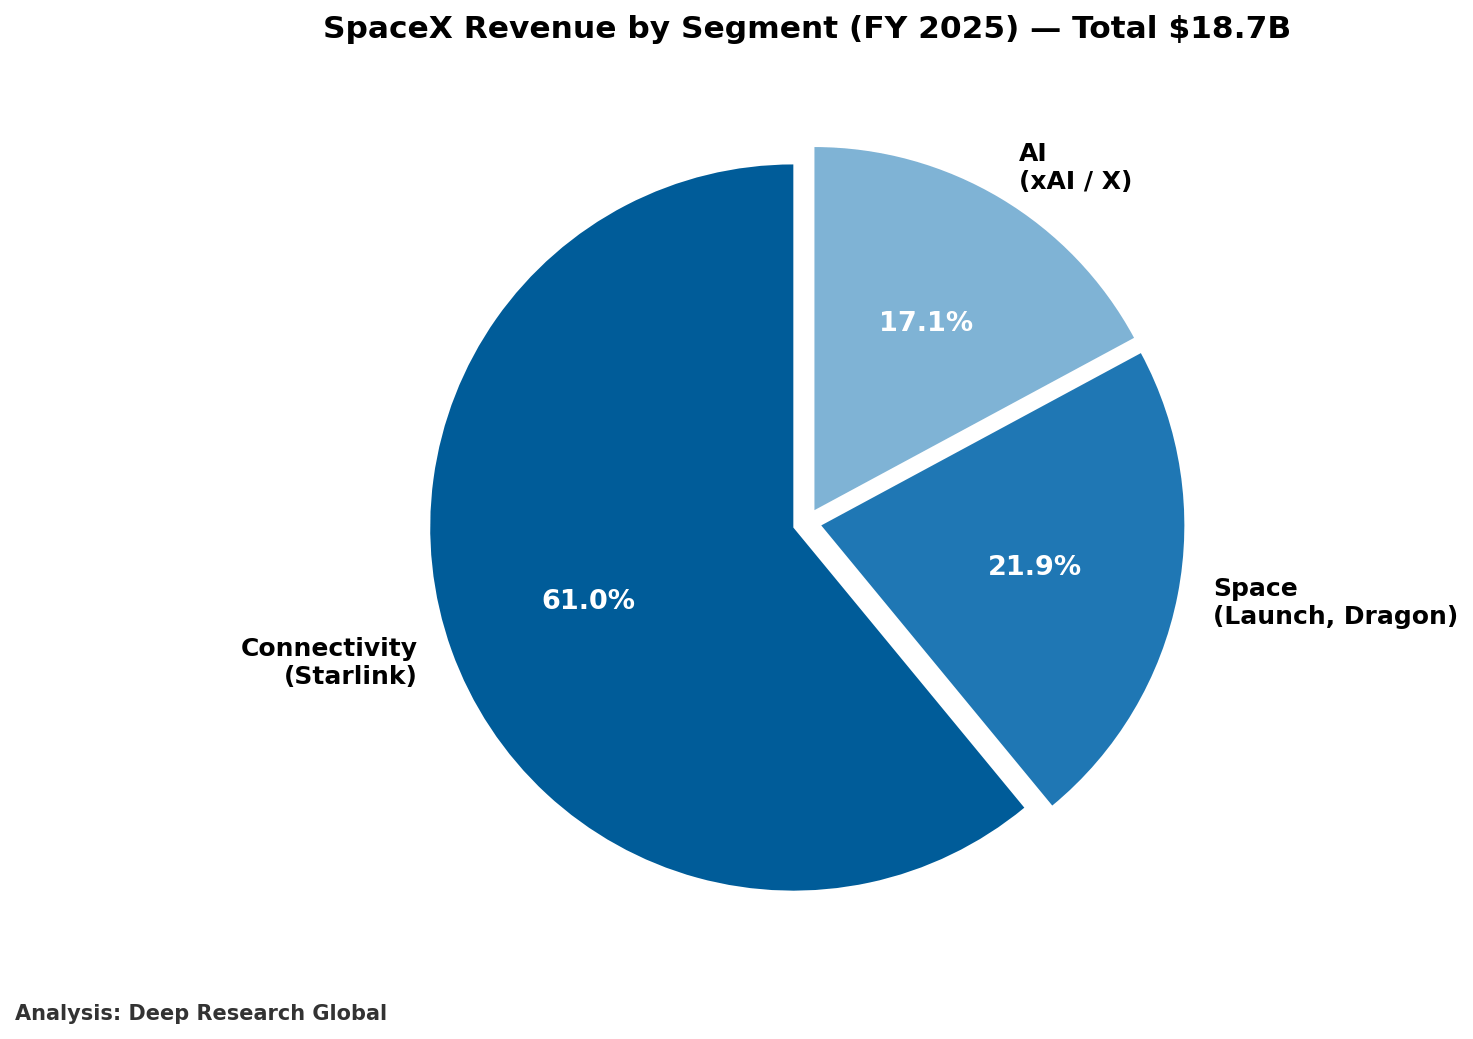
Image source: Deep Research Global analysis, based on SpaceX S-1 filing dated May 20, 2026. Pie chart shows Connectivity at 60.9%, Space at 21.9%, AI at 17.1% of FY 2025 revenue.
What jumps out from the S-1 is the