
Starbucks (SBUX) - Fundamental Analysis Report 2026 (Updated)

Dear Readers, Welcome to Deep Research Global.
Let’s analyze the topic in detail.
Executive TL;DR
Starbucks (SBUX) delivered the turn in its turnaround during Q2 fiscal 2026, posting a 9% jump in consolidated net revenue to $9.5 billion and global comparable store sales growth of 6.2%, with North America comps rising 7.1% on transaction-led demand.
The Back to Starbucks operating playbook from CEO Brian Niccol has restored top-line growth, while a closed transaction with Boyu Capital recapitalizes the China business and unlocks an aggressive path from roughly 8,000 to 20,000 stores in that market.
Fiscal 2028 financial guardrails point to 5% or greater revenue growth, non-GAAP operating margin of 13.5% to 15%, and EPS of $3.35 to $4.00, framing a multi-year operating leverage recovery story.
Headline risk includes execution complexity (loyalty re-tiering, menu reset, store remodels), intensifying competition from Dutch Bros and Luckin, and the dilutive optics of holding a 40% minority interest in China while still owning the brand and licensing economics.
Table of Contents
Executive TL;DR
Introduction
Starbucks Company Profile: Key Facts
Starbucks Investment Thesis
Pillar 1: Comp Sales as the Leading Indicator
Pillar 2: Margin Recapture Mechanics
Pillar 3: China JV as a Capital Allocation Reset
Starbucks Business Model Overview
Company-Operated Stores: The Cash Engine
Licensed Stores: The Margin Multiplier
Channel Development: The Hidden Margin Treasure
Starbucks Revenue Analysis
North America: The Engine That Slowed and Restarted
International: Turn in Nine Quarters
Channel Development: The Quiet Compounder
Latest Quarterly Earnings Walkthrough
The Headline Numbers
Operating Margin Composition
Guidance Raised
Margins, Earnings Quality, and EPS Trajectory
The Restructuring Drag
EPS Trajectory Modeled
Cash Flow Mechanics and Capital Allocation
Balance Sheet Health
Segment-by-Segment Teardown
North America: Where Comp Acceleration Lives
Remodel and Build Pipeline
International: Cross-Geography Recovery
Channel Development: The CPG Crown Jewel
Strategic and Competitive Context
Dutch Bros and the Drive-Thru Threat
Luckin: The China Counterpoint
The Independent Specialty Renaissance
Loyalty Program and Digital Strategy
The 35.5 Million Member Asset
Menu Innovation and Product Strategy
The 2026 Menu Reset
Protein and Functional Beverages
Operational Excellence: Green Apron Service
Smart Queue and AI Deployment
Mastrena 3 and Equipment Refresh
Store Footprint and Growth Pipeline
Geographic Distribution
The Long-Duration Unit Story
The China Joint Venture: A Structural Reset
Total Value Bridge
Operational Logic
Valuation Framework
Multiple Frameworks
Components of Intrinsic Value
Bull, Base, and Bear Case Scenario Analysis
Bull Case
Base Case
Bear Case
Key Risks for Starbucks
Risk 1
Risk 2
Risk 3
Risk 4
Risk 4
Catalysts to Watch
Q3 FY2026 Earnings
China JV Operational Cadence
Capital Return Reinitiation
Menu Performance Indicators
My Final Thoughts
Latest Analyst Price Targets
Official Sources and Data
Disclaimer: This analysis is for informational & educational purposes only and should not be construed as investment advice. Investors should conduct their own due diligence and consult with their personal financial advisors before making investment decisions. Past performance does not guarantee future results.
Introduction
Starbucks just printed something it has not produced for more than two consecutive quarters: simultaneous top and bottom line growth across every major geographic market it operates.
That single data point reframes the entire 2026 investment narrative because it’s the first quantitative evidence that the Back to Starbucks plan is compounding rather than merely stabilizing.
For investors evaluating SBUX as a long-duration operating story rather than a quarterly trade, the questions worth answering are mechanical and structural, not narrative.
How durable is the 7.1% North America comp?
How quickly can margins recompress upward toward the 13.5% to 15% fiscal 2028 framework?
And how should the China joint venture economics be modeled now that Starbucks holds a 40% minority interest rather than a wholly owned business with $3 billion-plus in annual revenue running through the consolidated P&L?
Starbucks Company Profile: Key Facts
Starbucks Corporation, headquartered in Seattle, is the world’s largest specialty coffee retailer and roaster by revenue, with operations spanning 40,990 stores at fiscal 2025 year-end across more than 80 markets.
The company sells through three reportable segments: company-operated and licensed retail in North America, the same dual structure internationally, and a Channel Development arm that monetizes the Starbucks brand through packaged coffee, ready-to-drink beverages, and a global coffee alliance with Nestlé.
STARBUCKS CORPORATION (SBUX) - QUICK FACTS
-----------------------------------------------------
Ticker:                NASDAQ: SBUX
Founded:               1971 (Seattle, WA)
CEO & Chair:           Brian Niccol (since Sep 2024)
CFO:                   Cathy Smith
Fiscal Year End:       Late September
FY2025 Net Revenue:    $37.2 billion
FY2025 GAAP EPS:       $1.63
Global Store Count:    41,129 (end of Q2 FY2026)
Reportable Segments:   North America, International,
                       Channel Development
Dividend (quarterly):  $0.62 per share
Dividend Status:       15 consecutive annual increases
The company’s economic engine is the company-operated store model, which accounted for 83% of fiscal 2025 net revenues and provides Starbucks with direct control over service, brand, pricing, and customer data.
Licensed stores supplement the footprint in airports, university campuses, and certain international markets, generating higher-margin royalty and product sale economics but lower revenue per location.
Brand equity remains the most underappreciated asset on the balance sheet.
The siren logo is recognized across markets where the company does not yet operate a single retail unit, and the loyalty database, which now contains 35.5 million 90-day active members in the United States alone according to first quarter disclosures, constitutes one of the largest first-party consumer datasets in global quick-service retail.
The leadership stack also matters more than usual right now because Niccol’s hiring from Chipotle in late 2024 represented the most consequential operating change at the company since Howard Schultz returned in 2022.
Niccol’s reputation for menu discipline, throughput engineering, and digital-first hospitality is the lens through which fiscal 2026 results should be interpreted.
Starbucks Investment Thesis
The investor case in 2026 rests on three quantitative pillars working in sequence: comp recovery driving incremental flow-through, margin recapture as restructuring charges roll off, and a credible long-duration unit growth story enabled by the China recapitalization.
Pillar 1: Comp Sales as the Leading Indicator
For the four quarters preceding fiscal 2026, North America comparable store sales were either flat or negative, a remarkable departure from a brand that compounded mid-single-digit comps for most of the prior decade.
The company has now stacked positive comps across both Q1 and Q2 of fiscal 2026, with the more recent quarter showing acceleration rather than deceleration.
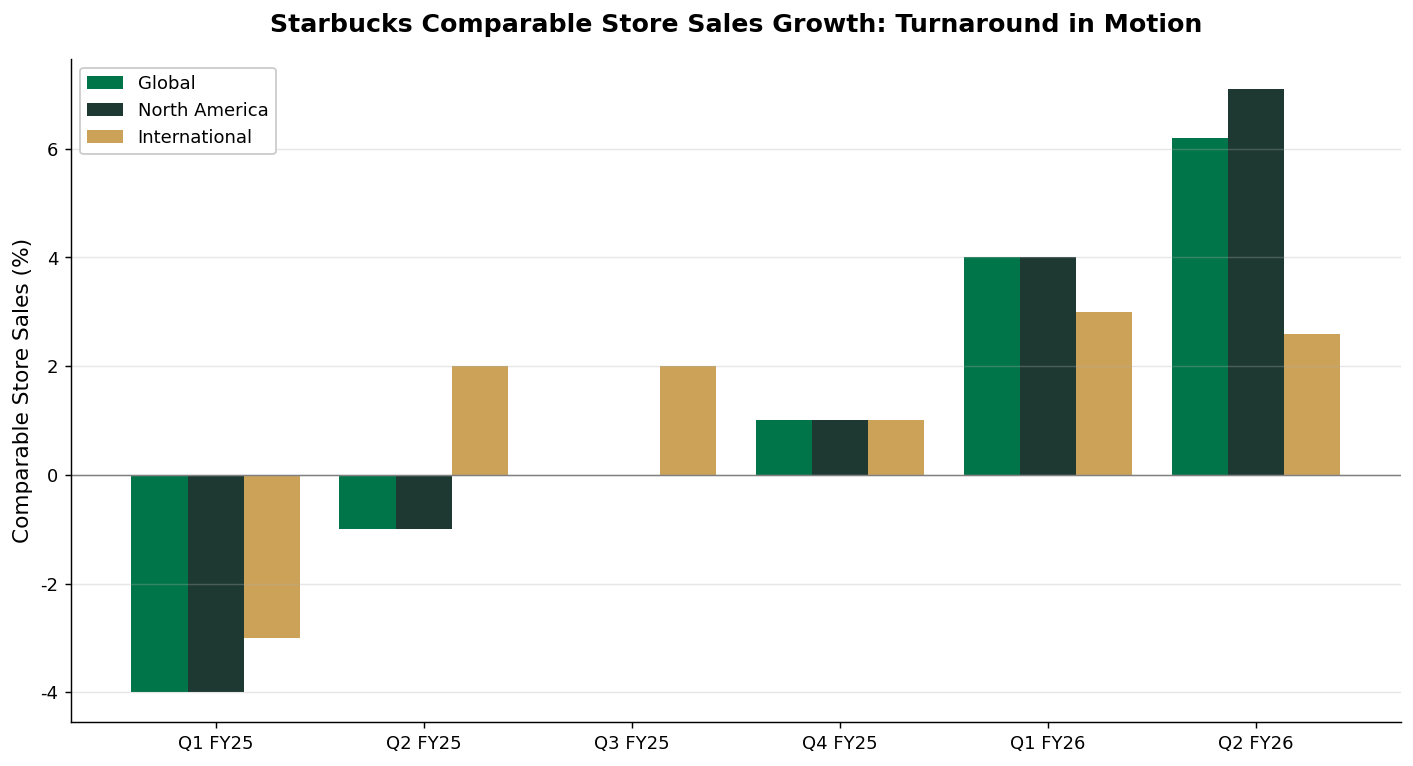
Image source: Deep Research Global analysis, based on Starbucks Investor Relations Q1 and Q2 FY2026 earnings releases.
What makes Q2 FY26 specifically interesting is the composition of growth.
North America comps rose 7.1%, but 4.4 percentage points of that came from transaction growth and only 2.6 percentage points from ticket.
Transaction-led comps are structurally healthier than ticket-led comps because they represent more customers returning more often, not the same customers absorbing price increases.
Q2 FY2026 COMPARABLE STORE SALES (TRANSACTION-LED)
-----------------------------------------------------
Global comps:           +6.2%
North America comps:    +7.1%
   - Transactions:      +4.4%
   - Average ticket:    +2.6%
International comps:    +2.6%
China comps:            +0.5%
The international turn is equally important.
All ten of Starbucks’ largest international markets delivered positive comparable sales for the first time in nine quarters, breaking a long trend of regional softness across Europe, the Middle East, and parts of Asia outside of China.
Pillar 2: Margin Recapture Mechanics
Fiscal 2025 ended with a GAAP operating margin of 7.9%, a 710 basis point compression from the prior year that reflected restructuring charges, accelerated store remodels, and labor reinvestment under the Back to Starbucks playbook.
The fiscal 2028 target of 13.5% to 15% non-GAAP operating margin therefore implies roughly 550 to 700 basis points of margin recovery over three years.
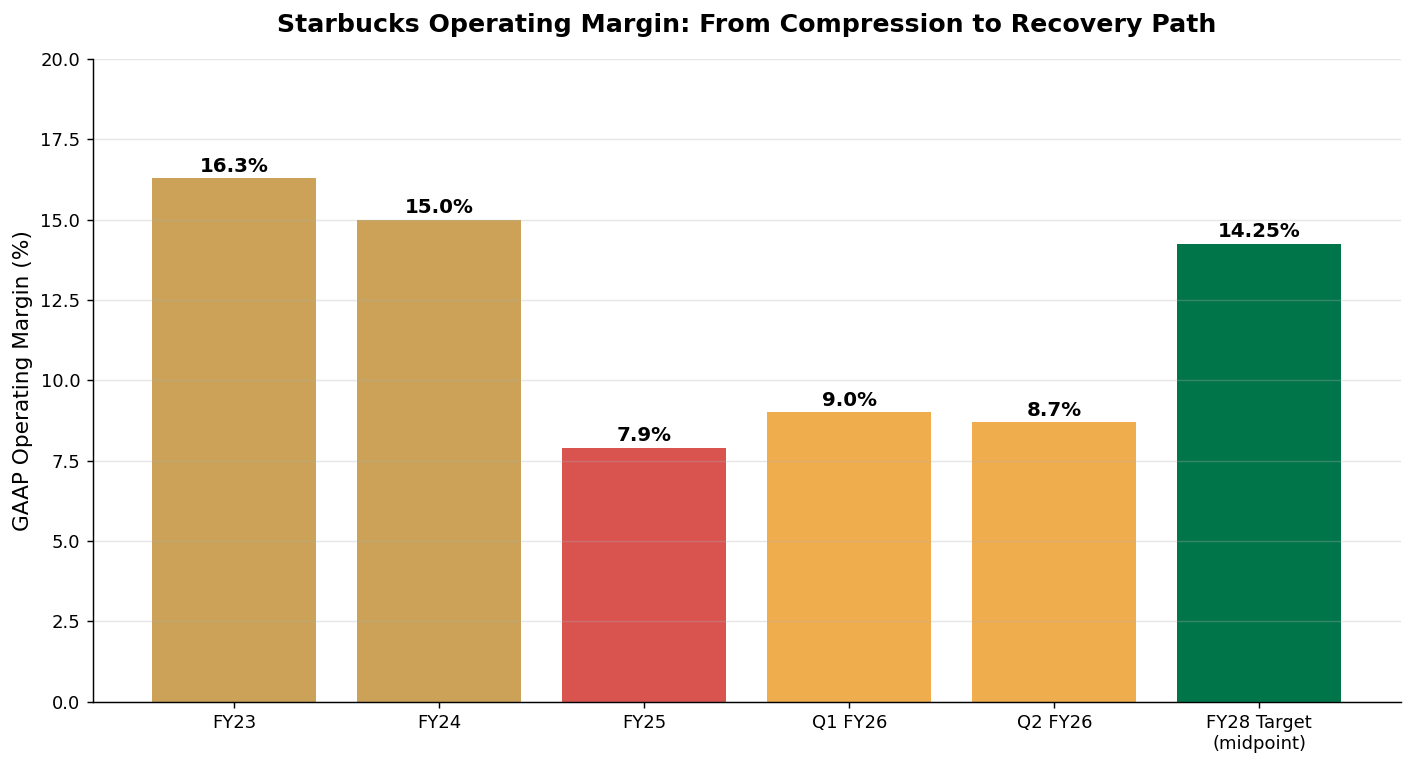
Image source: Deep Research Global analysis, based on Starbucks fiscal 2025 annual report and FY2026 quarterly earnings releases.
The arithmetic on that recovery is the most important number in the entire SBUX model.
Each 100 basis points of operating margin on roughly $38 billion of revenue translates to approximately $380 million of incremental operating income, which at the current diluted share count flows through to a meaningful EPS step-up. CFO Cathy Smith made the sequencing explicit on the Q2 call, noting that topline improvement comes first with earnings growth to follow.
Pillar 3: China JV as a Capital Allocation Reset
The Boyu Capital transaction is not just a divestiture, it’s a structural reframing of how investors should value the China business.
By selling 60% for $4 billion while retaining 40% of equity and the brand and intellectual property licensing economics, Starbucks effectively converted a slow-growth, low-margin operating business into a higher-margin royalty stream plus minority equity participation in an accelerated unit growth plan.
The company indicated the total value of the China business could exceed $13 billion when combining proceeds, retained equity value, and the net present value of licensing economics, against a backdrop of a planned expansion from approximately 8,000 to 20,000 units over time.
Starbucks Business Model Overview
The Starbucks operating system is best understood as three interlocking revenue layers stacked on top of a single coffee supply chain. Each layer monetizes a different aspect of brand reach and contributes a different unit economic profile.
Company-Operated Stores: The Cash Engine
The company-operated channel accounted for $7.86 billion of revenue in Q1 FY26 standalone and remains the primary mechanism through which Starbucks captures full retail margin on each transaction.
Because Starbucks owns the store, the partners, the inventory, and the digital relationship, every incremental customer visit translates directly into both revenue and the ability to harvest first-party data.
Image source: Starbucks Stories

Unit economics here are highly leveraged to comp transactions.
Fixed costs across rent, utilities, and partner staffing scale slowly, so a 4.4 percentage point transaction comp tends to translate disproportionately into store-level profit, which is precisely the dynamic that produced the Q2 FY26 operating income jump to $828 million from levels well below that in the prior quarter.
COMPANY-OPERATED ECONOMICS (ILLUSTRATIVE)
-----------------------------------------------------
Revenue: 100% recognized in P&L
Cost of Sales: Coffee, dairy, packaging, food
Store Operating: Labor (largest variable), rent
Operating Leverage: HIGH on transaction comps
Capital Intensity: HIGH (new builds + remodels)
Capex per New Store: Varies by format and marketLicensed Stores: The Margin Multiplier
Licensed locations operate under third-party ownership in venues like airports, grocery stores, hotels, and certain international markets where local partners possess regulatory advantages or real estate access.
Starbucks earns royalties on sales, sells branded products and proprietary equipment to licensees, and recognizes licensing revenue that carries far higher gross margin than company-operated revenue.
This channel is structurally important to the long-term margin recovery story because as the international footprint scales toward 40,000 locations, a meaningful portion of that growth will come through licensed and joint-venture structures, including the new China JV, where Starbucks does not consolidate operating revenue but does collect ongoing royalty economics.
Channel Development: The Hidden Margin Treasure
The third segment is the least appreciated by retail investors. Channel Development generated $1.87 billion of revenuein fiscal 2025 with an operating margin of 47.3%, a structurally premium margin profile that exists nowhere else in the company.
This segment sells Starbucks coffee through grocery, mass, and specialty retailers globally through the Global Coffee Alliance with Nestlé, monetizes ready-to-drink beverages through a partnership with PepsiCo in North America, and licenses single-serve coffee pods.
The economics here resemble a consumer packaged goods business with a coffee specialty premium, and the margin contribution is disproportionate to revenue.
Starbucks Revenue Analysis
Total fiscal 2025 consolidated net revenue reached $37.2 billion, a 3% increase over fiscal 2024 driven primarily by new store openings rather than comparable store sales, which were modestly negative on a global basis.
The revenue trajectory tells a clear story of the past three years: post-pandemic recovery, mid-cycle slowdown, and now a 2026 reacceleration.
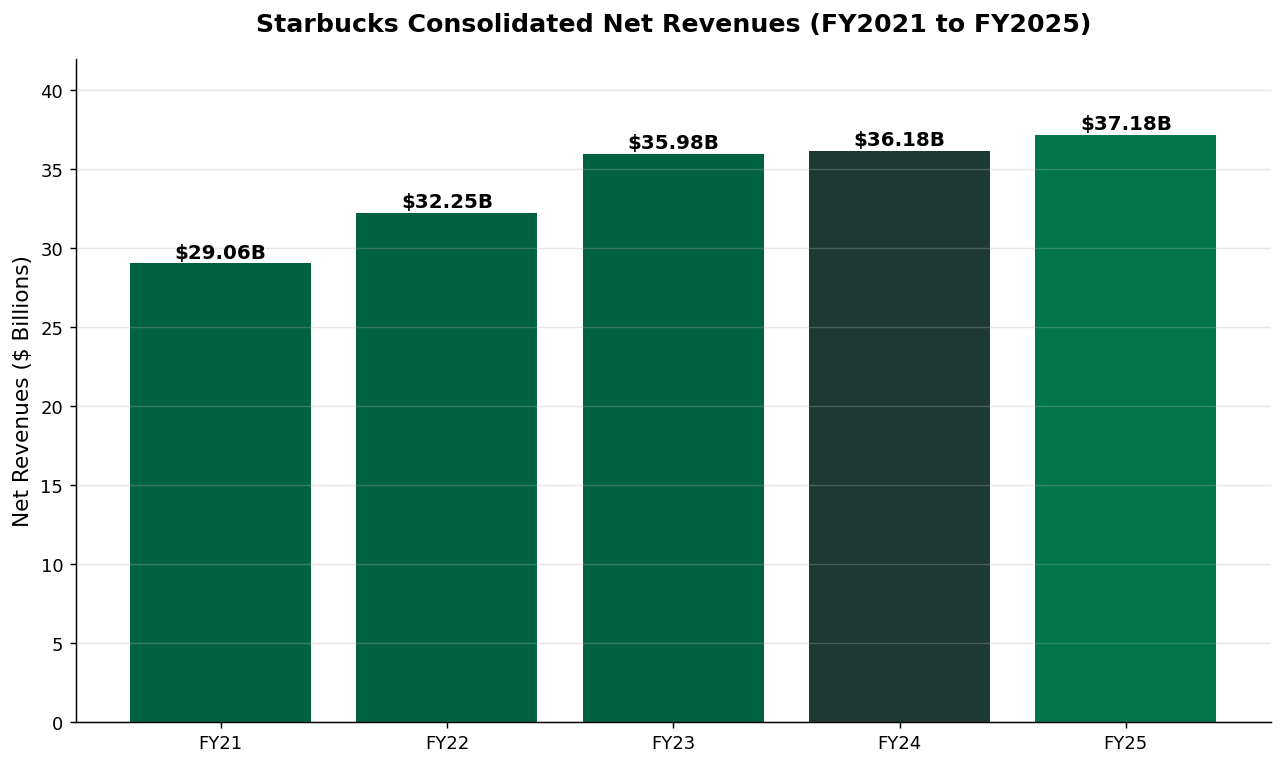
Image source: Deep Research Global analysis, based on Starbucks annual reports FY2021 through FY2025.
The first half of fiscal 2026 already points to acceleration. Q1 delivered $9.9 billion of net revenue, a 6% year-over-year increase, while Q2 delivered $9.5 billion at 9% growth.
The asymmetric pattern between transaction-driven comps in North America and the China comp recovery suggests the company is exiting the worst of its volume softness while still digesting price normalization.
REVENUE BY SEGMENT - FISCAL YEAR 2025
-----------------------------------------------------
North America:        $27,373 million  (74% of total)
International:         $7,820 million  (21% of total)
Channel Development:   $1,872 million  ( 5% of total)
Corporate and Other:     $120 million  (~0% of total)
-----------------------------------------------------
TOTAL NET REVENUES: $37,185 million (100.0%)North America: The Engine That Slowed and Restarted
North America revenue rose to $7.28 billion in Q1 FY26 and accelerated to $6.89 billion in Q2 FY26 (the seasonal pattern is lower in Q2 due to the fiscal calendar).
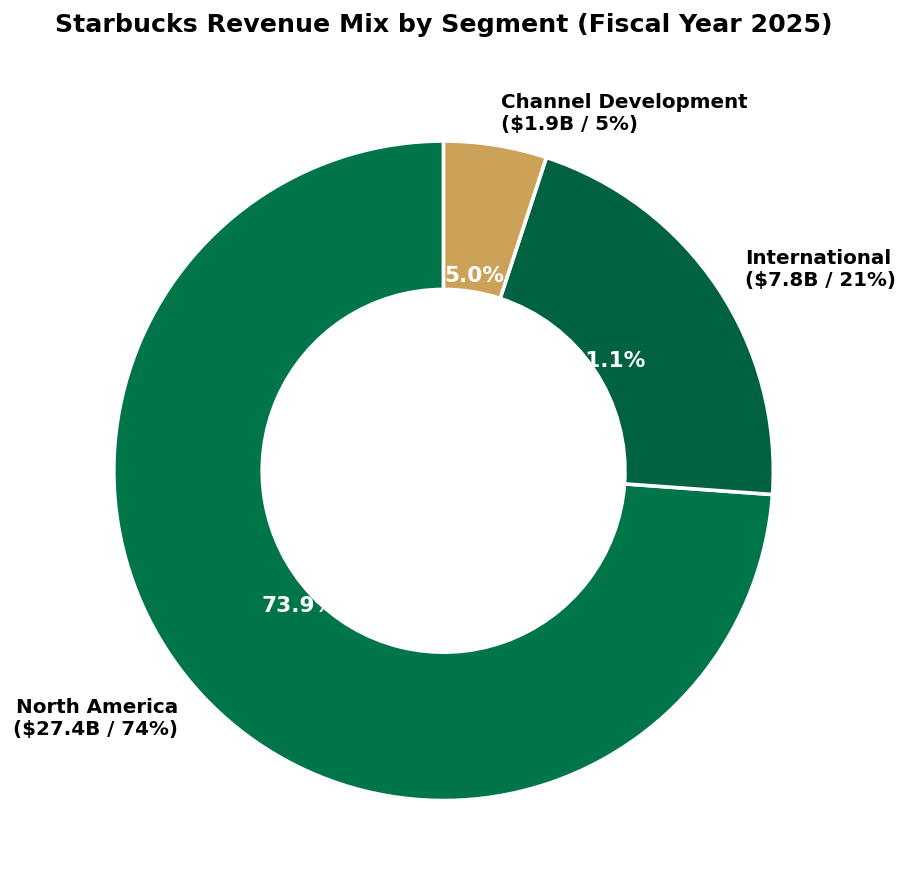
Image source: Deep Research Global analysis, based on Starbucks FY2025 10-K segment disclosures.
The segment operating income story is more nuanced. North America operating income actually fell year-over-year in absolute terms during Q2 as labor reinvestments and remodel-related occupancy charges weighed on flow-through.
For investors modeling the next few quarters, the watch item is whether