Walmart - Company Analysis and Outlook Report (2026)

Executive TL;DR

  • Walmart $WMT ( ▼ 0.73% ) posted Q3 FY2026 revenue of $179.5 billion (up 5.8% YoY) with 27% global e-commerce growth and operating margins expanding to 3.3%.

  • The company is transitioning from pure retail to a tech-powered ecosystem with high-margin businesses (advertising up 53%, Walmart Connect up 33%) driving profitability.

  • Walmart joins the Nasdaq-100 on January 20, 2026, reflecting its evolution toward technology leadership and commanding over 25% of U.S. grocery market share.

  • Free cash flow reached $8.8 billion for the nine months ended October 2025, supporting a robust capital return program while investing heavily in automation and AI infrastructure.

Also Read:

Table of Contents

Business Overview and Key Facts

Walmart Inc. operates as the world’s largest retailer with a fiscal 2025 revenue base of $681 billion.

The company employs approximately 2.1 million associates globally across three primary business segments.

Business Segment

Revenue Contribution

Key Characteristics

Walmart U.S.

69% ($462.4B FY25)

4,606 stores across formats; dominant grocery position

Walmart International

18%

Operations in 18 countries including Mexico, China, India

Sam’s Club U.S.

13%

600+ membership warehouse clubs; 13M+ members

Revenue Drivers (Last Twelve Months)

Primary Growth Engines:

E-commerce has become a central pillar. Global digital sales surged 27% in Q3 FY2026, with seventh consecutive quarter exceeding 20% growth.

Store-fulfilled delivery drove nearly 50% of e-commerce expansion. Approximately 35% of store-fulfilled orders were delivered within three hours.

The advertising business represents a transformative profit center. Walmart Connect grew 33% in the U.S., while global advertising revenue jumped 53% when including VIZIO acquisition.

Membership income accelerated 17% globally. Walmart+ subscriber growth reached double-digits, contributing to higher-margin recurring revenue streams.

Key Product Lines and Categories

Category

Performance (Q3 FY26)

Strategic Importance

Grocery

Low single-digit comp growth

Core traffic driver; 60%+ of U.S. sales

Health & Wellness

Low double-digit growth

Pharmacy scripts growing; optical strength

General Merchandise

Low single-digit growth

Fashion, home, auto care gaining share

Private Label

90+ bps mix increase

Higher margins; brand differentiation

Latest Strategic Developments and News

Nasdaq-100 Inclusion Signals Transformation

On January 10, 2026, Nasdaq announced Walmart’s addition to its technology-focused Nasdaq-100 index effective January 20, 2026.

The stock surged 3% on the announcement, closing at $117.97. This milestone could attract approximately $19 billion in index-fund inflows.

The inclusion underscores Walmart’s evolution from traditional retail to a technology company. AI deployment, digital advertising platforms, and e-commerce infrastructure now define the company’s competitive advantage.

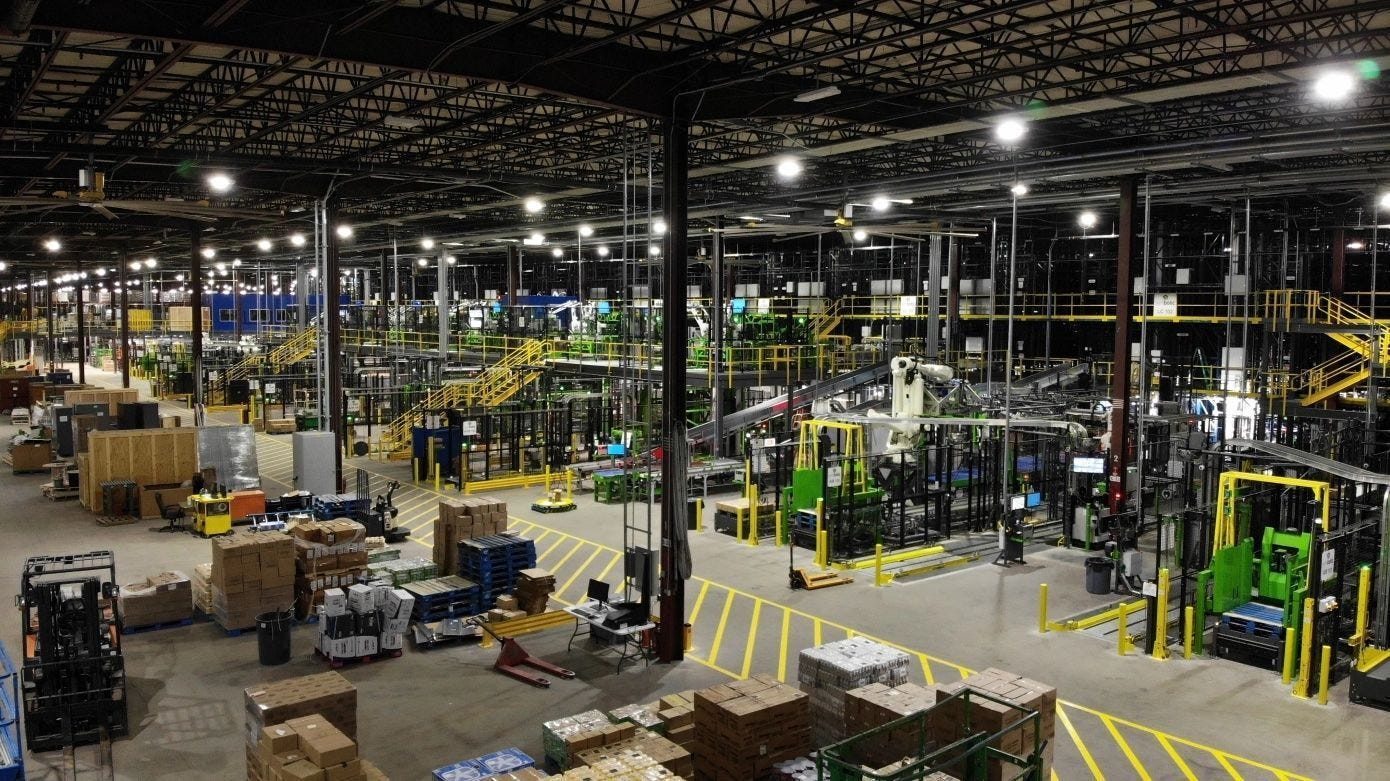
Automation and Supply Chain Revolution

The company is deploying Symbotic robotic systems across regional distribution centers. These AI-powered systems increase throughput while reducing labor intensity.

Four next-generation automated fulfillment centers are under construction. These facilities will support the growing demand for rapid e-commerce order fulfillment.

International Expansion Momentum

Mexico Performance:
Sales reached $12.7 billion with 5.1% constant currency growth. The company opened 175 new stores over the past year, strengthening its position as the country’s leading retailer.

China Growth:
Revenue surged 21.8% to $6.1 billion. Digital sales now represent over 50% of total sales, up 390 basis points year-over-year. Sam’s Club expansion continues with eight new clubs opened in the past 12 months.

India Strategy:
Operating through Flipkart and PhonePe, Walmart is capturing high-growth digital commerce opportunities. The Big Billion Days event timing contributed to strong quarterly performance.

Drone Delivery Expansion

This represents one of the largest commercial drone delivery deployments in retail. Customers can receive orders within 30 minutes for thousands of eligible items.

Competitive Analysis and Economic Moat

Porter’s Five Forces Analysis

Competitive Rivalry: STRONG

Walmart faces intense competition across all channels. Amazon holds 37.6% of U.S. e-commerce market share, while Walmart commands 6.3%.

However, Walmart leads in grocery with over 25% market share. The company gained 0.75% market share between 2021-2024, while Target lost 0.18%.

Competitor

Market Position

Key Differentiator

Amazon

E-commerce leader ($638B revenue)

Digital infrastructure, Prime ecosystem

Costco

Warehouse club model

Higher margins (50x P/E); membership loyalty

Target

Upscale discount retail

Younger demographics; design partnerships

Bargaining Power of Buyers: WEAK

Walmart’s scale creates significant pricing power. The company’s “Everyday Low Prices” strategy makes it difficult for consumers to negotiate.

Individual customers represent minimal revenue concentration. The diversified customer base across income levels reduces buyer power.

Bargaining Power of Suppliers: WEAK

As the world’s largest retailer, Walmart commands substantial leverage over suppliers. The company’s purchasing volume allows for favorable terms.

Private label expansion further reduces supplier power. Walmart can manufacture or source alternatives if supplier terms become unfavorable.

Threat of New Entrants: LOW TO MODERATE

Retail requires massive capital investment in distribution networks, technology infrastructure, and store locations. Walmart has invested decades building these assets.

E-commerce platforms represent the primary new entry threat. However, establishing profitable operations at scale remains challenging without physical infrastructure.

Threat of Substitutes: MODERATE

Online retailers, specialty stores, and direct-to-consumer brands offer alternatives. Dollar stores capture budget-conscious consumers in certain categories.

Walmart’s omnichannel approach mitigates substitution risk. The company provides multiple fulfillment options including pickup, delivery, and in-store shopping.

Market Share and Competitive Position

U.S. Grocery Market Share (2026):
━━━━━━━━━━━━━━━━━━━━━━━━━━━━
Walmart         ████████████████████████▓  25%+
Kroger          ████████▓                  8-10%
Costco          ███████▓                   7-9%
Amazon/Whole    ████▓                      4-6%
Others          ████████████████████       48-50%

Walmart maintains dominant positioning in brick-and-mortar grocery. The company processes over 230 million customer transactions weekly across channels.

Switching Costs and Customer Lock-In

Walmart+ membership creates recurring relationships. The $98 annual fee provides free delivery, fuel discounts, and streaming services.

Scan & Go technology adoption increased 450 basis points at Sam’s Club, enhancing convenience and creating habit formation.

However, true switching costs remain relatively low for non-members. Price-sensitive consumers can easily compare alternatives and shift purchasing.

Financial Deep Dive

Historical Revenue and Growth Trends

Fiscal Year

Revenue

YoY Growth

Operating Income

FY 2023

$611.3B

6.7%

$25.0B

FY 2024

$648.1B

6.0%

$27.0B

FY 2025

$681.0B

5.1%

$29.5B

FY 2026 (Guide)

$713-718B

4.8-5.1%

$30.9-31.1B

Revenue growth has maintained mid-single digit consistency. The company benefits from steady comparable sales gains and new store additions.

Q3 FY2026 delivered $179.5 billion in total revenues, representing 5.8% reported growth and 6.0% constant currency growth.

Margin Analysis and Profitability Trends

Gross Margin Evolution:

Q3 FY2026 gross margin reached 24.2%, up 2 basis points year-over-year. Walmart U.S. drove improvement with 27.6% gross margin, up 19 basis points.

Strong inventory management and improved business mix (digital advertising) contributed to expansion. However, grocery’s growing sales mix creates ongoing pressure as the category carries lower margins.

Operating Margin Progression:

Operating Margin Trajectory:
━━━━━━━━━━━━━━━━━━━━━━━━━━━━

FY23: 4.09%  ████████████████████▓
FY24: 4.17%  ████████████████████▓▓
FY25: 4.33%  █████████████████████▓
FY26: 4.31%  █████████████████████
(LTM)

Operating margins improved to 3.3% in Q3 FY2026, up from sub-3% levels in previous years.

Adjusted operating income grew 8.0% constant currency, outpacing 5.9% net sales growth. This operating leverage demonstrates improving business model efficiency.

Net Income Margin:

Net income margin increased approximately 80 basis points in Q3 FY2026. Adjusted EBITDA margin expanded roughly 20 basis points.

However, a $700 million non-cash share-based compensation charge at PhonePe (ahead of potential IPO) temporarily pressured reported margins.

Free Cash Flow Analysis

Period

Operating Cash Flow

CapEx

Free Cash Flow

9M FY25

$22.9B

$16.7B

$6.2B

9M FY26

$27.5B

$18.7B

$8.8B

Change

+$4.5B (+20%)

+$1.9B

+$2.6B (+42%)

Operating cash flow growth of 20% resulted from improved operating income, timing benefits on certain payments, and lower cash tax payments.

Capital expenditures increased $1.9 billion to support automation initiatives, new store openings, and technology infrastructure. Management guides to approximately 3.5% of net sales for full-year FY2026.

FCF Margin Trends:

FCF margin currently sits around 1.70%, below the 13-year median of 3.06%. The compression reflects aggressive growth investments that should drive future returns.

Annual free cash flow for FY2025 was $13.1 billion, down 14.8% from FY2024’s $15.4 billion due to elevated capital spending.

Return on Investment Metrics

Return on Investment (ROI) reached 14.8% for the trailing twelve months ended October 31, 2025. This represents a 30 basis point decline from the prior year’s 15.1%.

The decrease stems primarily from higher average invested capital due to property and equipment purchases. A 25 basis point impact resulted from the PhonePe compensation charge.

Return on Assets (ROA) improved to 8.4%, up 60 basis points year-over-year. Higher operating income and favorable investment gains drove the expansion despite asset base growth.

Valuation Analysis

Discounted Cash Flow (DCF) Analysis

Multiple DCF models suggest varying intrinsic values for Walmart shares:

Source

DCF Intrinsic Value

Current Price

Upside/(Downside)

SimplyWall.st

$126.90

$114.53

10.8%

ValueInvesting.io

$132.04

$114.53

15.3%

GuruFocus

$31.48

$114.53

(72.5%)

AlphaSpread

$66.03

$114.53

(42.4%)

Base Case DCF Assumptions:

Discount Rate (WACC): 10%
Terminal Growth Rate: 3%
FY2026-2030 Revenue CAGR: 4-5%
FCF Margin Expansion: 50-100 bps over 5 years

Using a 10% discount rate and 3% terminal growth, a mid-range intrinsic value estimate of $126-127 per share appears reasonable.

This suggests Walmart trades at fair value to slight undervaluation relative to fundamental cash flow generation capacity.

Comparable Company Analysis

Company

P/E Ratio

Forward P/E

EV/EBITDA

Price/Sales

Walmart

39.9x

38.2x

14.2x

1.05x

Amazon

45.2x

35.4x

22.1x

3.84x

Costco

49.4x

41.4x

25.8x

1.18x

Target

16.3x

15.2x

9.8x

0.74x

Sector Avg

27.2x

26.1x

12.4x

0.95x

Walmart currently trades at a P/E of 39.9x, significantly above the Consumer Retailing industry average of 22.9x and peer group average of 27.2x.

The premium valuation reflects:

  • Superior growth profile compared to traditional retailers

  • High-margin business mix shift toward advertising and technology

  • Demonstrated resilience across economic cycles

  • Attractive dividend yield of 1.1% with 52-year consecutive increase history

However, Walmart’s valuation has raised concerns among some analysts who view the 40x earnings multiple as stretched relative to mid-single digit top-line growth.

Sensitivity Analysis

DCF Sensitivity Table (Intrinsic Value per Share)

WACC →         8%      9%      10%     11%     12%
Term Grth ↓
2.0%          $152    $138    $126    $116    $107
2.5%          $162    $146    $133    $122    $112
3.0%          $174    $155    $140    $128    $118
3.5%          $188    $166    $149    $135    $124
4.0%          $205    $179    $159    $143    $130

The valuation proves most sensitive to discount rate assumptions. A 100 basis point change in WACC drives approximately 11-12% change in intrinsic value.

Terminal growth rate assumptions carry meaningful impact. The 2.5-3.5% range appears most defensible given U.S. GDP growth plus modest market share gains.

Catalysts and Timeline

Near-Term Catalysts (Next 6-12 Months)

Q1: Nasdaq-100 Index Addition (January 20, 2026)

The official inclusion could drive $15-19 billion in passive fund inflows. Index tracking funds must purchase shares to maintain proper weightings.

Technical buying pressure may support price appreciation independent of fundamentals. Historical analysis shows new additions experience permanent stock price gains and increased institutional holdings.

Q2: FY2026 Full-Year Results (February 2026)

Management will provide FY2027 guidance, setting expectations for continued momentum. Key metrics to watch include:

  • Operating margin trajectory toward 4.5-5.0% target

  • E-commerce profitability improvements

  • Advertising revenue run-rate exceeding $4 billion annually

Q3: Automation Milestone Achievement (By January 31, 2026)

Walmart targets 65% of stores serviced by automated distribution by fiscal year-end. This represents a major operational transformation expected to reduce costs and improve fulfillment speed.

Medium-Term Growth Drivers (1-3 Years)

Walmart+ Membership Expansion

Current penetration remains below 10% of U.S. households. Amazon Prime boasts over 180 million members globally, suggesting substantial runway.

Each 1% penetration increase represents approximately 1.3 million households and $125-150 million in annual recurring revenue at current pricing.

Healthcare Expansion

Walmart operates over 4,000 pharmacies and 3,000 vision centers. The company is expanding primary care clinics and telehealth services.

Healthcare represents a $4+ trillion addressable market in the U.S. Even modest penetration could add billions in higher-margin revenue.

International Digital Growth

Flipkart and PhonePe in India position Walmart for explosive digital payment and e-commerce growth. India’s digital economy is projected to reach $1 trillion by 2030.

A successful PhonePe IPO would unlock significant value. The platform processes over 10 billion transactions monthly with 450+ million users.

Long-Term Strategic Opportunities (3-5 Years)

Advertising Business Maturation

Walmart Connect grew 33% in Q3 FY2026, six times faster than sales growth. The global advertising business including VIZIO expanded 53%.

Retail media networks command premium CPMs due to first-party purchase data. Amazon’s advertising business generates over $40 billion annually with 30%+ margins.

If Walmart captures 15-20% of Amazon’s advertising share over five years, this could represent $6-8 billion in incremental high-margin revenue.

Supply Chain as a Service

Walmart’s logistics capabilities could be monetized through third-party fulfillment services. The company already operates marketplace facilitating third-party seller growth of 40%+ in general merchandise.

Competing with Amazon’s FBA (Fulfillment by Amazon) network represents a multi-billion dollar opportunity leveraging existing infrastructure.

Catalyst Timeline

Q1 2026

Q2-Q4 2026

2027-2028

2029-2030

Key Events

Nasdaq-100 addition

Automation milestones

Healthcare scale

Advertising maturity

Revenue Impact

Passive inflows

Margin expansion

New revenue streams

High-margin mix shift

Key Risks and Probability Assessment

Operational and Competitive Risks

1. Amazon E-Commerce Competition (Probability: HIGH)

Amazon maintains dominant 37.6% U.S. e-commerce market share versus Walmart’s 6.3%. The competitive gap persists despite Walmart’s 27% digital growth.

Recent analysis shows Amazon maintains price leadership over Walmart in key categories. Walmart’s fashion prices ran 7% higher than Amazon’s in 2025.

Potential Impact: Continued market share pressure in high-margin categories; reduced pricing power

Mitigation: Omnichannel advantage with physical stores; faster local delivery; grocery anchor driving traffic

2. Tariff and Trade Policy Risk (Probability: MEDIUM-HIGH)

Walmart CEO warned “higher tariffs will result in higher prices” for consumers. The company sources significant product volume from China and other international markets.

Tariff cost increases force difficult decisions between margin compression or price increases. Price hikes could reduce transaction volumes and competitive positioning.

Potential Impact: 50-100 basis points gross margin pressure; reduced comparable sales growth; market share losses

Mitigation: Supplier diversification; nearshoring initiatives; private label flexibility; scale leverage in negotiations

3. Labor Cost Inflation (Probability: MEDIUM)

Persistent labor shortages drive wage pressure across retail. Walmart invested in associate wage increases, contributing to operating expense deleverage.

Unionization efforts at select locations could accelerate cost increases. Minimum wage legislation changes pose additional risk.

Potential Impact: 20-40 basis points operating margin pressure annually; $500M-$1B incremental costs

Mitigation: Automation and AI deployment reducing labor intensity; productivity improvements; scale advantages versus smaller competitors

Financial and Valuation Risks

4. Valuation Multiple Compression (Probability: MEDIUM)

Walmart trades at 40x earnings, well above 5-year average of 26x. The premium valuation assumes continued strong execution and margin expansion.

Disappointment on key metrics (e-commerce growth, advertising, margins) could trigger multiple reversion. A return to 30-32x P/E would imply 20-25% downside.

Potential Impact: Share price decline of 15-25% independent of fundamentals; increased volatility

Mitigation: Continued earnings growth providing support; dividend yield floor; defensive characteristics during economic uncertainty

5. Capital Allocation and Investment Returns (Probability: LOW-MEDIUM)

Walmart increased capital expenditures to 3.5% of sales, up from historical 2.5-3.0% range. ROI declined to 14.8% from 15.1% due to higher invested capital.

If automation and technology investments fail to deliver projected returns, capital efficiency would deteriorate further.

Potential Impact: Sustained ROI compression to 12-13% range; reduced FCF generation; lower valuation multiples

Mitigation: Disciplined capital allocation processes; phased automation rollout allows course correction; proven execution track record

Regulatory and External Risks

6. Antitrust and Regulatory Scrutiny (Probability: LOW-MEDIUM)

Walmart’s market dominance attracts regulatory attention. Data privacy laws (GDPR, CCPA) and antitrust scrutiny pose compliance costs and operational constraints.

Potential restrictions on mergers, acquisitions, or business practices could limit growth optionality.

Potential Impact: $100-300M annual compliance costs; restricted M&A activity; forced divestitures

Mitigation: Proactive regulatory engagement; compliance investments; distributed market share reduces single-market dominance concerns

Risk Summary Matrix

Risk Category

Probability

Severity

Time Horizon

Key Mitigation

Amazon Competition

High

Medium

Ongoing

Omnichannel integration

Tariffs/Trade

Medium-High

High

6-18 months

Supply diversification

Labor Costs

Medium

Medium

12-36 months

Automation deployment

Valuation Compression

Medium

High

6-24 months

Earnings growth delivery

Investment Returns

Low-Medium

Medium

24-48 months

Disciplined capital allocation

Regulatory

Low-Medium

Low-Medium

Ongoing

Compliance programs

SWOT Analysis

Strengths

Unmatched Scale and Distribution Network

Walmart operates 10,482+ locations across 24 countries with over 230 million weekly customer transactions. This physical footprint provides last-mile delivery advantages that pure digital players cannot replicate.

The company processes more than $680 billion in annual sales, creating unparalleled purchasing power and supplier leverage.

Omnichannel Integration Excellence

95% of U.S. households can receive store-fulfilled delivery in less than 3 hours. Nearly 50% of e-commerce growth came from store-fulfilled delivery.

The seamless integration of digital and physical creates convenience advantages. Customers can order online and pickup in-store, or receive rapid home delivery from nearby locations.

Financial Strength and Cash Generation

Investment-grade credit rating with manageable 2.1x debt/EBITDA leverage. $27.5 billion in nine-month operating cash flow provides substantial financial flexibility.

52 consecutive years of dividend increases demonstrate shareholder return commitment. $5.1 billion remains under current share repurchase authorization.

Data and Technology Capabilities

Proprietary first-party shopping data across hundreds of millions of customers creates competitive advantages in merchandising, pricing, and advertising.

AI and machine learning deployments optimize inventory, demand forecasting, and supply chain efficiency.

Weaknesses

Thin Profit Margins

Operating margins of 3-4% leave limited room for error. Competitors with higher margin business models (Costco membership fees, Amazon AWS) enjoy greater financial cushion.

Grocery-heavy sales mix pressures profitability as food carries lower margins than general merchandise.

E-Commerce Profitability Challenge

While digital sales grow rapidly, e-commerce economics remain less favorable than stores. Delivery costs, fulfillment expenses, and customer acquisition spending compress margins.

Walmart has not disclosed specific e-commerce profitability metrics, suggesting ongoing losses or minimal profitability in the channel.

International Business Complexity

Operating across 24 countries creates execution complexity and regulatory burden. Currency fluctuations impact results, with $200 million negative effect in Q3 FY2026 alone.

Some international markets (Canada, UK historically) have struggled with profitability and competitive positioning.

Brand Perception Challenges

Walmart’s value-focused positioning attracts price-sensitive shoppers but limits premium product opportunities. Upscale consumers may prefer Target, Whole Foods, or specialty retailers.

Labor relations concerns and quality perceptions occasionally generate negative publicity impacting brand reputation.

Opportunities

Healthcare Expansion

Walmart’s pharmacies, vision centers, and growing clinic network position the company to capture healthcare spending. The $4+ trillion U.S. healthcare market offers substantial growth potential.

Affordable primary care and wellness services align with Walmart’s value proposition and serve underserved communities.

Financial Services Through PhonePe

India’s PhonePe digital payment platform processes 10+ billion monthly transactions. A successful IPO could value PhonePe at $12-15 billion.

Walmart owns ~67% stake representing $8-10 billion in value largely unrecognized in current stock price. Payment processing and fintech generate recurring, high-margin revenue.

Advertising Business Scaling

Retail media networks represent the fastest-growing advertising category. Walmart Connect’s 33% growth rate positions it as the third-largest retail media network behind Amazon and Instacart.

VIZIO acquisition brings connected TV inventory enabling video advertising capabilities. The combined platform could reach $5+ billion in annual revenue by 2028.

Automation Cost Savings

65% of stores serviced by automated distribution by early 2026 drives substantial efficiency gains. Labor productivity improvements flow directly to margin expansion.

Automated fulfillment centers process orders 3-5x faster than traditional facilities while requiring 40-50% less labor hours per unit.

Threats

Dollar Stores and Discounters

Dollar General, Dollar Tree, and Five Below aggressively expand in rural and suburban markets. These competitors offer convenient neighborhood locations with low prices on select categories.

Aldi and Lidl European discounters continue U.S. expansion with ultra-low prices putting pressure on Walmart’s value positioning.

Economic Recession Risk

Consumer spending accounts for 70% of U.S. GDP. Economic downturn would reduce discretionary purchases and pressure average ticket.

While Walmart benefits from trade-down during recession, overall volume decline and margin pressure typically result.

Technological Disruption

Rapid innovation in retail technology requires continuous investment. Failure to keep pace with Amazon, emerging startups, or international competitors could erode competitive position.

Direct-to-consumer brands leveraging social media and influencer marketing bypass traditional retail, capturing millennial and Gen Z spending.

Climate and Sustainability Pressures

Increasing focus on environmental impact and carbon emissions creates compliance costs. Supply chain disruption from extreme weather events threatens inventory availability.

Consumer preferences shifting toward sustainable and local products may disadvantage global supply chains and mass production models.

SWOT Summary

Internal Factors

External Factors

Positive

Scale, omnichannel, data (Strengths)

Healthcare, fintech, advertising (Opportunities)

Negative

Margins, e-comm profitability (Weaknesses)

Competition, recession, disruption (Threats)

PESTEL Analysis

Political Factors

Trade Policies and Tariffs

U.S.-China trade tensions create uncertainty for sourcing strategies. Tariffs on Chinese imports force Walmart to either absorb costs or pass to consumers.

The 2026 political environment includes discussions of additional trade restrictions. Walmart’s global supply chain makes it particularly sensitive to protectionist policies.

Labor and Employment Regulations

Minimum wage legislation varies by state and municipality. Federal proposals for $15-17 minimum wage would increase labor costs substantially.

Healthcare mandates, overtime rules, and scheduling requirements create compliance complexity across thousands of locations.

International Operations Complexity

Operating in 24 countries requires navigation of diverse political systems. Mexico operations face security challenges and political transitions.

China’s regulatory environment includes data localization requirements and technology transfer mandates.

Economic Factors

Consumer Spending and Confidence

Retail sales directly correlate with disposable income and consumer confidence levels. Current environment shows resilient spending despite elevated interest rates.

Walmart benefits from serving customers across income spectrums. Upper-income households led share gains in Q3 FY2026, suggesting broad-based appeal.

Inflation and Cost Pressures

Like-for-like inflation of 1.3% in Q3 FY2026 remains elevated but moderating. Food inflation pressures persist while general merchandise sees deflation in select categories.

Transportation costs, energy prices, and commodity fluctuations impact operating expenses. Walmart’s scale provides some insulation but cannot eliminate exposure.

Interest Rate Environment

Higher rates increase borrowing costs for expansion and working capital. Walmart’s strong balance sheet minimizes impact, but mortgage-rate-sensitive consumer spending (housing, durables) slows.

Currency fluctuations affect international operations, with strong dollar reducing translated revenues.

Social Factors

Health and Wellness Trends

Consumers increasingly prioritize health, nutrition, and wellness. Walmart expanded organic offerings, fresh food, and pharmacy services to capture this demand.

Aging U.S. population drives healthcare spending growth, benefiting pharmacy and vision center businesses.

Digital Native Generations

Millennials and Gen Z expect seamless digital experiences, rapid fulfillment, and social commerce integration. Walmart’s technology investments target these demographics.

Scan & Go adoption at Sam’s Club increased 450 basis points, demonstrating customer embrace of friction-reducing technology.

Sustainability and Corporate Responsibility

Environmental consciousness influences purchasing decisions. Walmart committed to zero-emissions supply chain by 2040 and renewable energy goals.

Social equity concerns include labor practices, supplier conditions, and community impact. Walmart’s size makes it a prominent target for advocacy groups.

Technological Factors

AI and Machine Learning

Walmart deployed AI for demand forecasting, inventory optimization, and personalized recommendations. These capabilities drive margin improvement through reduced waste and improved conversion.

Computer vision enables automated checkout, shelf scanning, and inventory tracking reducing manual labor requirements.

Automation and Robotics

Symbotic systems in distribution centers increase throughput 25-35% while reducing labor hours 40-50%.

Autonomous floor cleaners, shelf-scanning robots, and automated micro-fulfillment centers improve efficiency in stores.

E-Commerce Platform Evolution

Marketplace capabilities enable third-party seller growth, expanding assortment without inventory risk. Walmart marketplace general merchandise sales grew over 40%.

Payment processing, customer data platforms, and advertising technology create new revenue streams beyond traditional retail.

Environmental Factors

Climate Change and Extreme Weather

Supply chain vulnerability to hurricanes, wildfires, and flooding increases. Temperature extremes affect agricultural production and food prices.

Walmart committed $7+ billion to sustainability initiatives including renewable energy, electric vehicle fleet, and sustainable packaging.

Resource Scarcity and Waste

Water availability, agricultural inputs, and packaging materials face long-term constraints. Sustainable sourcing programs address supply chain resilience.

Food waste reduction initiatives and circular economy programs reduce environmental impact while improving margins through waste elimination.

Data Privacy and Security

GDPR (Europe), CCPA (California), and emerging regulations govern customer data collection and usage. Compliance requires significant technology investment.

Cybersecurity incidents pose legal liability and reputational risk. Walmart’s vast customer database makes it an attractive target for bad actors.

Employment and Labor Law

Wage and hour class action lawsuits create financial exposure. Walmart’s 2.1 million employees generate substantial employment law complexity.

OSHA safety requirements and workers’ compensation obligations require robust compliance programs.

Antitrust and Competition

Federal Trade Commission and Department of Justice scrutiny of large retailers could restrict M&A activity or force business practice changes.

State-level regulations on specific products (alcohol, tobacco, firearms) create localized compliance requirements.

PESTEL Factor

Current Impact

Trend

Strategic Response

Political

Medium

Stable

Supply diversification

Economic

Medium-High

Improving

Omnichannel value proposition

Social

High

Accelerating

Digital investment, sustainability

Technological

High

Accelerating

AI, automation deployment

Environmental

Medium

Intensifying

Renewable energy, efficiency

Legal

Medium

Stable

Compliance programs, risk management

Analyst Price Targets and Consensus

Aggregate Analyst Sentiment

44 analysts cover Walmart with an average price target of $124.35, implying approximately 6-8% upside from current levels around $114-118.

The consensus recommendation sits at “Moderate Buy” to “Buy,” reflecting generally positive sentiment tempered by valuation concerns.

Analyst Firm

Rating

Price Target

Date

Key Thesis

Telsey Advisory Group

Outperform

$135.00

Jan 2026

E-commerce acceleration, margin expansion

TD Cowen

Buy

$130.00

Jan 2026

AI integration, omnichannel strength

Wells Fargo

Overweight

$130.00

Dec 2025

Top pick for 2026, market share gains

Morgan Stanley

Equal Weight

$108.00

Nov 2025

Valuation concerns at 40x P/E

Goldman Sachs

Buy

$128.00

Nov 2025

Digital transformation accelerating

Price Target Distribution

Analyst Price Target Range:

Low: $62     ████
Mean: $124   ████████████████████████████████
High: $136   █████████████████████████████████████

Current: ~$115-118

The wide range reflects divergent views on valuation methodology and growth sustainability. Bulls emphasize Walmart’s technology transformation and margin expansion runway.

Bears focus on stretched multiples relative to mid-single-digit revenue growth and structural retail headwinds.

Notable Recent Upgrades and Downgrades

TD Cowen (December 2025): Named Walmart to “Best Ideas 2026” list. Analyst Oliver Chen highlights AI becoming embedded across the business and predictive intelligence evolving.

Seeking Alpha (January 2026): Published bearish analysis titled “Walmart Is Overvalued - I’ve Just Sold My Shares” citing 40x P/E as mathematically unsupportable relative to growth.

Goldman Sachs (November 2025): Maintained Buy rating following Q3 results, praising 27% e-commerce growth and advertising momentum.

Long-Term Price Projections

Analysts project Walmart stock at $118-125 (bullish) to $88-102 (bearish) by end of 2026. The 5-year outlook suggests $130-145 per share by 2030 under base case scenarios.

Motley Fool estimates roughly $143 by 2030, assuming 7% annualized appreciation plus dividends.

However, valuation multiples likely compress from current 40x toward historical 28-32x range as growth normalizes. This creates headwind requiring 10-12% annual earnings growth just to maintain current prices.

SEC Filings and Official Documents

This comprehensive annual report provides complete financial statements, business segment details, risk factors, and management discussion.

Most recent quarterly filing with updated financial results and interim period disclosures.

Earnings Materials

Q3 FY2026 Earnings Release (November 20, 2025):
Walmart Releases Q3 FY26 Earnings

Official press release announcing Q3 results, guidance updates, and management commentary.

Q3 FY2026 Earnings Presentation:
Earnings Presentation (FY26 Q3) PDF

Detailed slide deck with segment performance, financial metrics, and operational highlights.

Investor Relations Resources

Walmart Investor Relations Portal:
stock.walmart.com

Central hub for financial information including income statements, balance sheets, cash flow statements, and historical filings.

Financial Results Page:
Financial Results - Walmart Inc.

Quarterly and annual results with downloadable datasets for analysis.

Transcripts and Conference Calls

Q1 FY2026 Earnings Call Transcript (May 15, 2025):
Q1 FY26 Earnings Call Transcript PDF

Management prepared remarks and Q&A with analysts covering strategy, operational performance, and outlook.

Additional References

Annual Report and Proxy Statement:
Walmart Releases 2025 Annual Report

Comprehensive review of fiscal 2025 performance with corporate governance information.

Corporate Newsroom:
Walmart Corporate News

Official company announcements, press releases, and corporate updates.

Third-Party Analysis and Market Data

My Final Thoughts

Walmart has successfully navigated the existential threat posed by Amazon’s e-commerce dominance. It did this not by abandoning physical retail but by weaponizing it.

The 10,500+ store network transformed from potential liability to competitive advantage. Store-fulfilled delivery reaches 95% of America in under three hours. No pure digital player can match this.

However, the valuation reflects extraordinary expectations. At 40x earnings compared to historical 26x, investors are pricing in flawless execution on multiple fronts simultaneously.

The advertising business must scale to $5-10 billion annually with 30%+ margins. Automation investments totaling billions must deliver promised productivity gains. E-commerce must reach profitability while maintaining growth.

International operations (particularly PhonePe) must generate substantial returns to justify embedded values.

For long-term investors, Walmart offers compelling qualities. The 1.1% dividend yield won’t excite income seekers, but 52 consecutive years of increases demonstrate commitment. Free cash flow generation of $13-15 billion annually supports both growth investment and shareholder returns.

The business model proves remarkably resilient across economic cycles. Recessions drive trade-down behavior benefiting Walmart’s value proposition.

For near-term traders, risks appear elevated. Any disappointment on key metrics (e-commerce growth slowing below 20%, advertising momentum fading, margins compressing) would likely trigger multiple contraction.

A reversion to 32-34x earnings would result in 15-20% downside even with earnings growth.

The Bull Case Requires:

  • E-commerce reaching 15-20% of total sales with positive margins by 2028

  • Advertising revenue reaching $8-10 billion with operating margins above 25%

  • Operating margins expanding to 4.5-5.0% through automation and mix shift

  • International contributing 25%+ of operating income versus current ~5%

  • PhonePe IPO valuing Walmart’s stake at $10+ billion

The Bear Case Considers:

  • Amazon’s continued e-commerce dominance limiting Walmart’s digital growth

  • Tariffs and trade tensions compressing gross margins 50-100 basis points

  • Labor inflation offsetting automation productivity gains

  • Economic recession reducing discretionary spending and average ticket

  • Valuation multiple compression to 28-32x driving 20-30% downside

My assessment suggests Walmart deserves a premium to traditional retail multiples given its transformation progress. However, 40x earnings appears full.

For existing shareholders, the position remains defensible based on business quality and execution track record. However, adding aggressively at current valuations requires conviction that all growth initiatives succeed simultaneously.

The Nasdaq-100 inclusion provides technical support near-term. Index fund buying of $15-19 billion could lift shares independent of fundamentals through mid-2026.

Beyond that window, results must justify expectations.

Walmart has earned the benefit of the doubt through consistent execution over decades. But at 40x earnings, there’s little room for error.

Disclaimer: This analysis is for informational purposes only and should not be construed as investment advice. Investors should conduct their own due diligence and consult with financial advisors before making investment decisions.

Reply

or to participate.